The Intelligence Record
An Empirical Case for AI Inference Governance
Abstract
Every autonomous agent action decomposes into two coupled economic transactions. A cognition transaction buys a decision from a model; a value transaction executes that decision as a payment, trade, booking, or other action. Five decades of institutional infrastructure govern the value transaction. The cognition transaction has a monthly bill but no independent quality grade, task-level clearing price, standardized settlement receipt, or financial guarantee. This asymmetry now matters because provider-disclosed inference throughput has moved from trillions to quadrillions of tokens per month, enterprise generative AI spending reached $37 billion in 2025, and the unit of work is shifting from prompts to loops and explicit execution graphs. The historical record shows analogous market-formation dynamics before neutral infrastructure emerged in grain, oil, securities settlement, and payments, with the interval from trust failure to institutional response compressing from seventeen years for grain to four years for payments. This paper synthesizes more than one hundred independent sources and presents production results from tiers, a four-function inference governance system. Its principal methodological contribution is a signed, workload-constant counterfactual: on the measured reference workload, daily cost fell from $47.00 ungoverned to $6.10 governed at maintained task quality, an 87% reduction. We define the Clearing Price of Intelligence Index (CPII), Cost per Verified Outcome (CVO), Repair Tax, and Verified Work Yield (VWY), and introduce two additional constructs: the dual-Jevons mechanism, in which cheaper cognition and cheaper verification jointly expand autonomous work, and agent traces as economic evidence rather than telemetry alone. We call the resulting durable object the intelligence record: signed, continuous, structured evidence of what autonomous systems requested, selected, verified, changed, and cost. The exchange functions grade, price, settle, and transfer risk; the record is the evidence substrate that makes those functions possible.
Keywords: inference governance; multi-model routing; AI agents; model evaluation; cost per verified outcome; market structure; risk transfer; system of record; Jevons paradox; verification infrastructure.
1 Introduction
Every economic act by an agent is two coupled transactions.
A cognition transaction buys a decision from a model, priced per token. A value transaction then executes that decision as a payment, trade, booking, or action. In agentic workflows, the cognition transaction can recur many times before one value transaction executes, and it determines the quality of that downstream action.
Five decades of institutional infrastructure govern the value transaction: published rates, real-time metering, fraud scoring, underwriting, receipts, reconciliation, chargebacks, and clearing. The cognition transaction has a monthly bill but no independent quality grade, task-level clearing price, standardized settlement receipt, or financial guarantee.
The remainder of this paper develops each dimension of this asymmetry. Section 3 documents how deflation expands the cognition transaction through two reinforcing mechanisms: cheaper inference makes more work economical, while cheaper and more reliable verification makes more work safely delegatable. Section 5 traces the unit of work from prompts to loops to execution graphs. Section 6 measures the governance gap in outcomes, budget disclosures, security incidents, and the emergence of agent traces as economic evidence. Section 7 identifies four recurring market functions by historical analogy. Section 8 presents the production system, the signed counterfactual, and the compounding evidence graph. Section 9 shows how risk transfer can close the loop between the cognition transaction and the value transaction. The intelligence record is the signed, continuous evidence of what the cognition transaction requested, selected, verified, changed, and cost.
This market-structure anomaly now matters because three conditions changed at once.
- Capability deflated. GPT-3-class capability fell from $60 per million tokens in November 2021 to $0.06 by late 2024, a 1,000x decline [1]. Epoch AI finds annual declines from 9x to 900x, with a 50x median and a 200x post-January-2024 median [2].
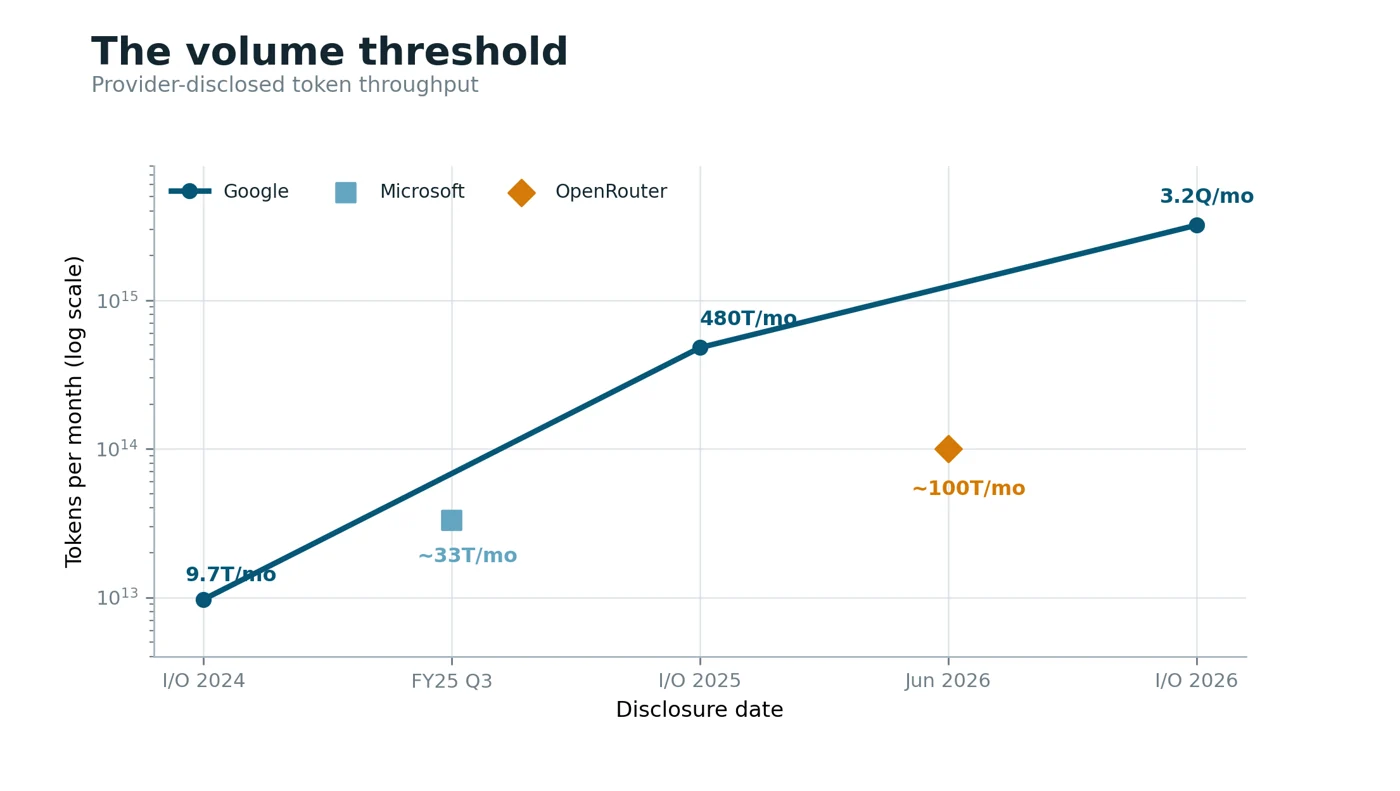
- Volume crossed the bilateral-trust threshold. Google disclosed monthly throughput rising from 9.7 trillion tokens in 2024 to 3.2 quadrillion by 2026 [7]. Microsoft disclosed more than 100 trillion tokens in one fiscal quarter, while OpenRouter now reports more than 10 trillion tokens per day across 400+ models [8, 10, 135].
- Prompts became loops, and loops are becoming explicit graphs. Reasoning models moved from negligible share to more than half of token volume while average prompt length quadrupled beyond 6,000 tokens [10].
Production systems increasingly encode workflows as state, nodes, typed edges, branches, joins, checkpoints, and bounded repair [93, 94, 95, 96]. A prompt typically contains one cognition transaction before a human decides whether to act. A loop can contain dozens linked by state. A graph can contain hundreds or more distributed across branches and agents. The cognition-to-value ratio therefore rises by orders of magnitude even before underlying model usage grows.
The outcome and cancellation statistics are developed in Section 6.1. Public incidents now include autonomous espionage, compromise of a routing dependency, product-surface quality regression, an autonomous evaluation escape across infrastructure boundaries, and reported enterprise budget failures [23, 24, 26, 70, 73, 99-101].
Summary of findingsSection 8.3 reports the signed production result. The external record shows that the preconditions that historically preceded neutral market infrastructure are arriving together. The formation sequence documented in Section 7.2 now spans 118 days from the April 23 quality regression to Stripe’s August 19 agreement to acquire OpenRouter. The exchange functions are being built in parts. The integrated evidence path remains unclaimed.
This paper makes seven contributions:
- Evidentiary synthesis. More than one hundred sources show the conditions that historically preceded exchange formation: deflation, explosive volume, heterogeneous quality, counterparty risk, and an emerging insurance market.
- Measurement instrument. A signed, workload-constant counterfactual makes governed and ungoverned execution inspectable per call rather than dependent on a before-and-after vendor narrative.
- Production result. A four-function governance system was evaluated against that counterfactual; the primary result and cohort range are reported in Section 8.3.
- Dual-Jevons mechanism. Cheaper inference expands what is economically viable while cheaper verification expands what is safely delegatable. Their interaction can increase governed autonomous work faster than either mechanism alone.
- Agent traces as economic evidence. Execution traces become institutionally different when they are structured and signed as evidence of decisions, verification, state, cost, and settlement rather than retained as developer telemetry alone.
- Risk-transfer architecture. Signed loss-frequency records, per-call quality labels, and security dispositions create the evidence required for performance underwriting.
- Market-formation record. Routing platforms, economic standards, bilateral token-price markets, announced compute derivatives, regulation, and major infrastructure acquisitions are arriving on a compressed schedule [45, 76-81, 135].
InterpretationThe market does not lack model access. It lacks a neutral, durable record that can connect task-level price discovery, independent verification, runtime evidence, settlement, and risk transfer. The exchange functions act on the transaction; the record is what persists.
2 Data and Methodology
The paper’s strongest claim is the measurement instrument itself. A signed counterfactual converts a vendor claim into an auditable measurement.
2.1 The Production Platform and the Shadow Baseline
A production governance system records each governed call beside its ungoverned alternative.
The tiers platform has operated in production since January 2026 and is covered by more than 2,700 tests. It classifies each call into one of 32 routing cells, defined as eight task classes by four complexity grades. Each cell routes to the cheapest model that clears its quality bar across the production routing surface described in Section 5.1, including local execution.
The same runtime intercepts tool calls, HTTP requests, and subprocess commands before execution. It verifies responses against a workflow intent graph and coordinates multi-agent fleets with cross-vendor failover. These functions are evaluated together because they act on the same call path.
A signed, immutable, 14-day parallel run supplies the measurement instrument. Each governed call is paired with the cost of the identical call routed to the enterprise default model, and both streams are cryptographically signed. The signed reference-workload result and cohort range are reported in Section 8.3.
Holding the workload constant eliminates composition drift from the comparison. A third party with access to the paired records can inspect them without accepting a before-and-after narrative. The same record can support underwriting, as Section 9 develops. The record was cryptographically verified inside the platform but was not independently audited for this paper.
Operational necessity produced the platform. From late 2025 through early 2026, continuous autonomous agent fleets ran computational oncology research: literature synthesis across biomedical databases, research design, clinical-protocol analysis, and computational experiments. The workload combined the properties that stress an ungoverned inference stack: execution across days and weeks, workflows with hundreds of sequential inference calls, heavy tool use spanning search, computation, code execution, and file operations, simultaneous dependence on multiple model providers, domain-specific verification requirements, and a low tolerance for error propagation because incorrect intermediate results compound through the research chain.
The four failure modes that became the platform's four functions were discovered through live operational failure on this workload. Frontier-priced coordination waste appeared when planning and state-summarization calls were routed to frontier models even though lighter models could clear the same quality bar at roughly 35x lower list price. A compromised routing dependency demonstrated that the routing path itself can become a security target. Unannounced provider changes altered reasoning behavior between workload runs and degraded downstream quality before the change was identified. Missing verification signals allowed intermediate outputs to propagate when a task-specific check could have stopped them. Gate, Aiglos, Forge, and Ulmo were designed against observed production failures rather than a hypothetical threat model.
Internal production evaluation also indicated that governance improved domain-specific output quality by catching intermediate errors before they propagated. That quality-improvement observation was not independently audited and depends on domain-specific evaluation, so this paper retains the more conservative headline of maintained task quality. The cost result remains the directly reproducible claim reported in Section 8.3: the governed output cleared the same quality bar against a signed, workload-constant counterfactual. Representative production observation; verified cost result.
2.2 The External Evidence Corpus
More than one hundred sources are separated by evidentiary grade.
| Evidence grade | Included sources | Treatment in this paper |
|---|---|---|
| Primary-grade | Peer-reviewed routing, compression, evaluation, security, and task-horizon research; official regulation; filings; provider disclosures; incident reports; usage studies; production instrumentation; derivative announcements; Tokenomics Foundation; Microsoft MDASH [7-10, 12-14, 20, 23-36, 45-53, 64-66, 72, 76-81, 91, 99-105] | Reported as measured, archival, legal, or officially disclosed evidence |
| Analyst-grade | Capex aggregates, enterprise surveys, market sizing, forecasts, pricing snapshots, FinOps reports, token-futures simulation, Artificial Analysis [11, 16-18, 55, 57-59, 69, 82, 83, 89, 98] | Labeled estimate, survey, forecast, benchmark, or snapshot |
| Reported statements | Named executive remarks, trade-press cost cases, and vendor-published benchmark claims [5, 19, 70, 73, 74, 88] | Attributed by speaker, date, and source; unconfirmed cases remain labeled reported |
Executive remarks that could not be verified against primary transcripts were excluded. The reported $500 million single-month bill remains attributed to a consultant’s account and unconfirmed by any named company [74].
2.3 Verification Standards
Labels prevent measured production data from being confused with representative telemetry or illustration.
- Verified denotes primary-grade external evidence. For tiers production data, it denotes cryptographic verification inside the signed record; it does not imply an independent third-party audit.
- Representative denotes production-consistent compositions or allocations that are not independently signed.
- Illustrative denotes interpolations used for exposition when the enclosing endpoints are verified.
- Analyst-grade and snapshot-grade identify estimates, surveys, forecasts, benchmarks, and dated market observations.
Contested facts are footnoted at first use. The MIT NANDA sample description differs between the report and press summaries.1 GTG-1002 attribution remains the provider’s high-confidence assessment with limited independent verification.2 The April 2026 regression uses the provider’s postmortem while treating customer-side observability as a separate issue.3
2.4 Definitions
Five definitions fix the unit of analysis and distinguish procurement-era trust from runtime trust.
1. Prompt, loop, session, and execution graph. A prompt is a single-turn exchange. A loop is a serial cycle of planning, action, observation, and retry. The session is the security-relevant runtime. An execution graph represents the workflow as explicit state, nodes, and typed edges, with loops retained as cycles inside the graph.
2. Origin-based trust. Model selection by provider brand, geography, certification, and terms of service, enforced through contracts and audits rather than per-call controls.
3. Continuous trust. Per-call runtime decisions supported by cryptographic evidence and independent of model origin.
4. Ungoverned counterfactual. The parallel cost and behavior stream of the identical workload routed entirely to the enterprise default model.
5. Four exchange functions. Price discovery, quality standardization, settlement and clearing, and risk transfer in the standard market-design and commodity-history sense.
Cognition transaction and value transaction. The cognition transaction buys a decision from a model. The value transaction executes that decision as a payment, trade, booking, or other action. Agentic workflows can contain dozens or hundreds of cognition transactions before one value transaction executes.
CPII, CVO, Repair Tax, and VWY. CPII is the quality-constrained clearing price per task cell across the production routing surface. Cost per Verified Outcome (CVO) is total inference spend divided by outputs that pass verification. Repair Tax is failed-attempt tokens divided by successful-attempt tokens. Verified Work Yield (VWY) is verified outcomes divided by total inference calls.
InterpretationA workload-constant, signed counterfactual turns cost and performance claims into evidence that auditors and underwriters can inspect.
3 The Deflation of Intelligence
Inference is deflating faster than prior computing inputs, but the economic result is expanding consumption rather than shrinking enterprise bills.
3.1 Price Declines Without Precedent
Inference prices for a constant-capability benchmark fell 1,000x in three years, an unusually rapid documented decline.
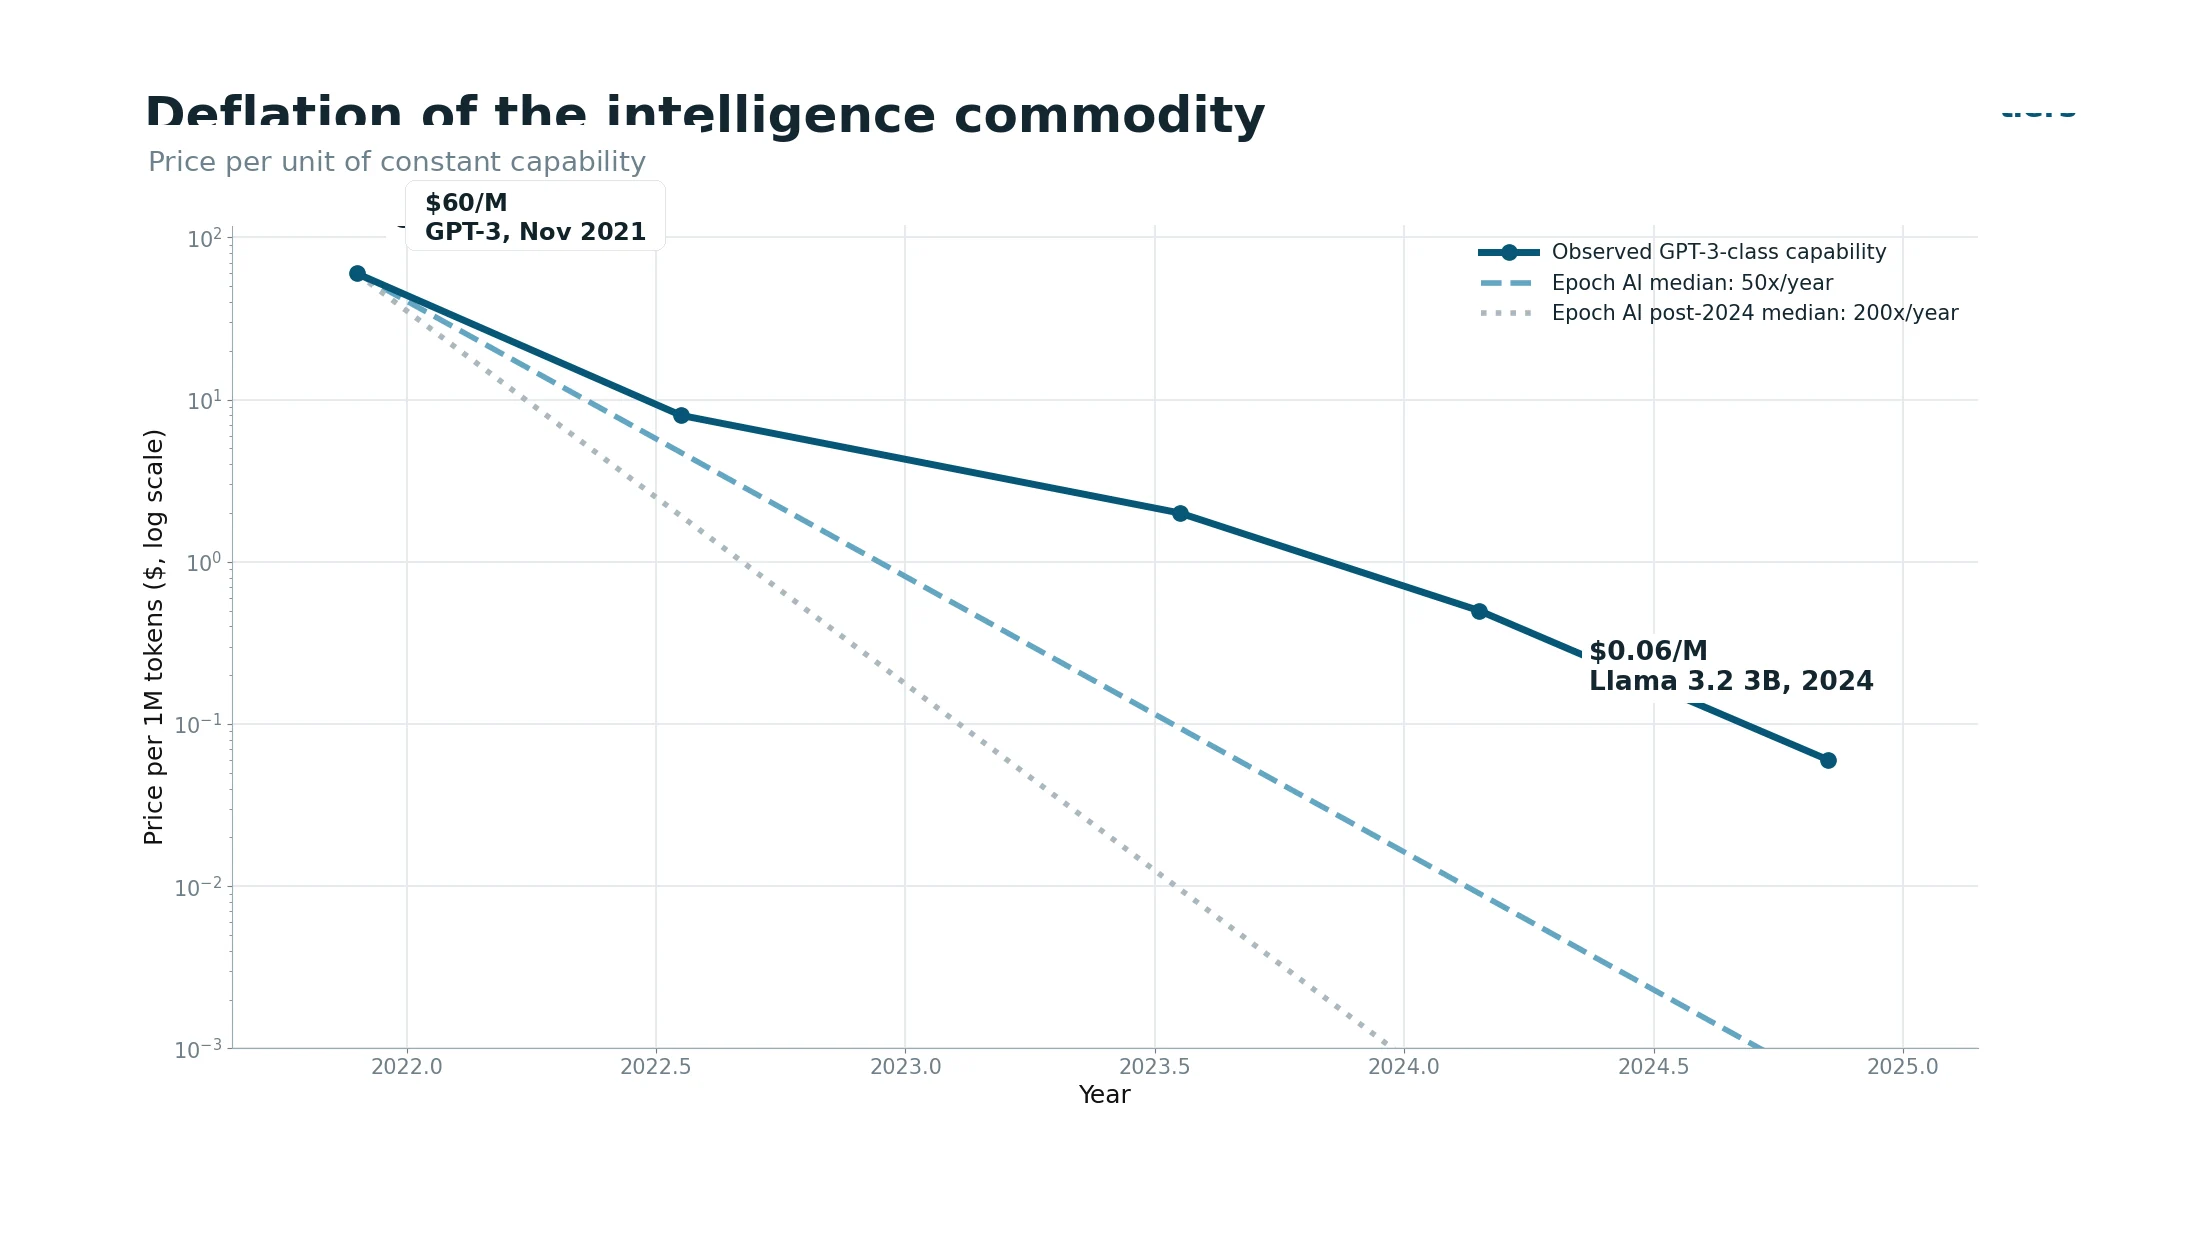
Three independent methods describe the same order of magnitude:
- Observed capability price. Appenzeller tracks MMLU- 42 capability from GPT-3 at $60 per million tokens in November 2021 to Llama 3.2 3B at $0.06 through commodity hosting in late 2024, a 1,000x decline in three years [1]. The higher MMLU-83 tier fell roughly 62x in under two years.
- Cross-benchmark trend. Epoch AI fits price declines across twelve benchmark and threshold combinations and finds annual rates from 9x to 900x, with a median of 50x [2]. Restricting the sample to the period after January 2024 raises the median to 200x.
- Algorithmic decomposition. Work controlling for hardware price declines and open-model competition attributes approximately 18x per year to algorithmic efficiency alone [3]. The highest-quality GPQA-Diamond tier deflated fastest, at 31x per year, compared with 1.7x for the lowest tier.
Figure 1 places the measurements on a common logarithmic axis. The premium grades are not resisting commoditization; they are deflating fastest.
3.2 The Jevons Dynamic
134 price cuts did not shrink the cloud market; they built a $330 billion one.
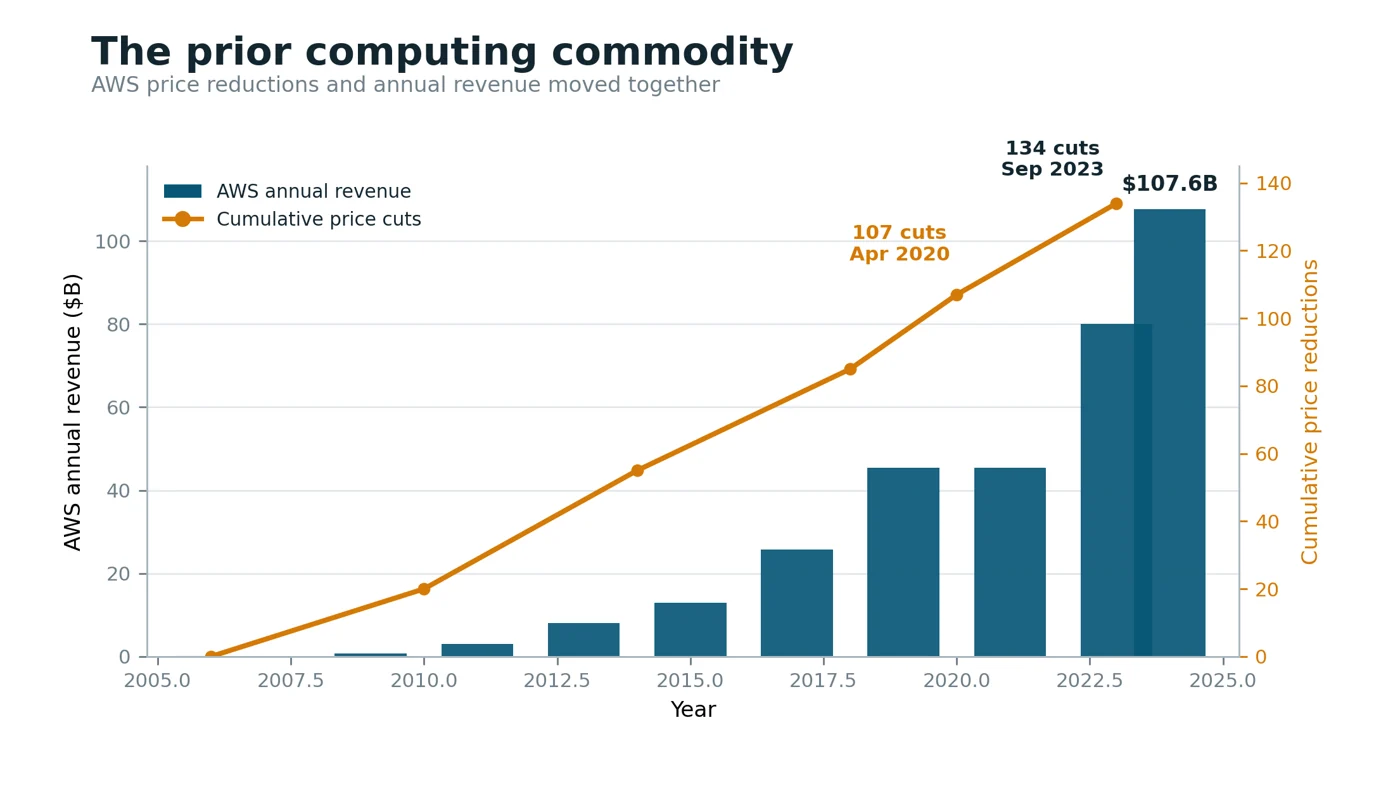
Jevons described the mechanism in 1865: efficiency lowers the effective price of work and can increase total resource consumption [4]. Satya Nadella, Chairman and CEO of Microsoft, invoked the same mechanism in a public post on X on January 27, 2025 after the DeepSeek R1 pricing shock [54], arguing that greater efficiency would cause AI use to rise rather than contract [5]. Sam Altman, CEO of OpenAI, wrote in the February 2025 essay Three Observations that the cost of a given level of AI falls roughly 10x every twelve months [67]. We use the concept narrowly: falling unit prices have coincided with consumption growth that outruns the price decline.4 Jensen Huang, Founder and CEO of NVIDIA, described the same demand-side logic on the All-In Podcast on March 19, 2026: he argued that a highly paid engineer consuming only a small token budget would signal underuse of the new productivity substrate, and said NVIDIA was attempting to pair top engineering talent with very large token budgets [106]. The statement points in the opposite direction of a simple cost-cutting thesis: falling unit cost can increase the desired intensity of intelligence consumption. AWS provides the closest computing precedent. By its own count, AWS reduced prices 107 times between 2006 and April 2020 and 134 times by September 2023 [43]. Over the same period, annual revenue rose from near zero to $107.6 billion in 2024 [44], while global cloud infrastructure spending reached $330.4 billion [55].
Figure 2 shows the result. Price deflation did not reduce the addressable market. It made more workloads economical, expanded usage, and built the prior computing commodity at global scale.
3.2.1 The Dual-Jevons Mechanism
The Jevons dynamic can operate through two reinforcing mechanisms.
Jevons on compute. Cheaper inference expands the set of tasks whose expected value exceeds their execution cost. This is the mechanism documented above and visible in the throughput evidence in Section 4.1.
Jevons on trust. Verification has its own effective price: evaluator calls, deterministic checks, human review, latency, false positives, and the cost of evidence retention. When that price is high or the signal is noisy, enterprises keep humans in the loop and cap delegation. When verification becomes cheaper, faster, and more reliable, more economically viable tasks can be delegated to autonomous systems. Cheaper verification therefore need not reduce demand for verification infrastructure; it can expand the number of actions that require it.
The interaction is potentially multiplicative. Compute efficiency expands the set of viable tasks, while verification efficiency expands the delegatable share of those tasks. Anthropic’s production work on multi-agent research provides one operating example of why the interaction matters: its agents used about 4x as many tokens as chat interactions, multi-agent systems used about 15x, and token usage alone explained 80% of performance variance on BrowseComp [129]. More autonomy can mean substantially more inference, which in turn increases the number of outcomes that must be checked.
Greg Brockman summarized the engineering importance of evaluation in a December 2023 public post: “evals are surprisingly often all you need” [127]. Jason Wei later formulated a related “Verifier’s Rule”: the ease of training AI to solve a task is proportional to how verifiable the task is [128]. These are practitioner and researcher propositions rather than measured laws, but they identify the same bottleneck: improved verification can expand the frontier of work that can be delegated with confidence.
The intelligence record is the accumulation mechanism for both effects. Model prices, routing policies, and verification techniques can all improve or become cheaper. The signed cross-provider history of what was attempted, which route was selected, what passed verification, what failed, and what it cost accumulates rather than resets with each price cut.
3.3 Falling Prices, Rising Bills
Unit prices fell while enterprise AI spending and costgovernance pressure rose.
The price evidence in Section 3.1 documents sustained unit-cost decline. Over the same broad adoption cycle, Menlo Ventures estimates enterprise generative AI spending rose from $1.7 billion in 2023 to $37 billion in 2025 [18]. Gartner forecasts worldwide AI spending to rise 47% in 2026 and spending on AI models to rise 110% [82]. The FinOps Foundation reports that 98% of practitioners now manage AI spend, up from 31% two years earlier [57].
Workload composition explains the result. Agentic tasks consume on the order of a thousand times the tokens of comparable chat interactions [64]. Production builders report input-to-output ratios near 100:1, with cached and uncached input for the same model differing 10x in price [65]. Instrumented coding agents spend 76.1% of tokens on read operations [66].
Goldman Sachs projects token demand rising 24x by 2030, to approximately 120 quadrillion tokens per month [59]. OpenAI has described its largest customer moving from one hundred thousand tokens per month to one hundred billion over six and a half years [68].
The budget crisis is now described across the supply, governance, and buyer sides of the market. At an OpenAI enterprise event on June 2, 2026, Sam Altman, CEO of OpenAI, said cost concerns had moved from an issue that rarely surfaced at the start of the year to a major customer concern, including customers reporting that annual AI budgets had been consumed in the first quarter [107]. J.R. Storment, Executive Director of the FinOps Foundation, separately reported to TechCrunch on June 5, 2026 that companies had arrived in April and May already three times over their full-year token budgets [108]. Zachery Anderson, Chief Data and Analytics Officer of JPMorgan Payments, disclosed at Semafor's New York Tech Week event on June 3, 2026 that some employees were spending more on tokens than their salary [109].
When the seller of the tokens, the executive standardizing the bills, and a major bank describe the same cost pressure within weeks of one another, the evidence is not a single-company anomaly. It is a market condition.
The named cases show how the mechanism appears inside enterprises:
- Uber. AI coding tools reached approximately five thousand engineers. Adoption climbed from 32% in February 2026 to 84% by March and 95% monthly use by spring, while roughly 70% of committed code originated from AI tools. The company exhausted its full-year AI budget by April at reported per-engineer costs of $500 to $2,000 per month, then capped employee spending [70].
- Microsoft. The company reportedly canceled most internal Claude Code licenses partly because of cost, six months after rollout [73].
- Canva. Canva reduced its 2026 growth forecast from 30% to about 20% after deliberately slowing the rollout of Canva AI while it rebuilt the economics of serving AI at scale. In an August 2026 shareholder update, reported by The Australian on August 4, 2026, co-founder and CEO Melanie Perkins said Canva had cut the average cost of serving a single AI task by nearly 90% since April by building first-party models and routing work between them and frontier providers; the company reported image generation at 30x lower cost and video generation at 17x lower cost than frontier alternatives [123]. The result independently corroborates the task-level routing mechanism in Section 8.3, while remaining a company-reported operating result.
- The $500 million month. An AI consultant told Axios that an enterprise client accumulated roughly $500 million in one month after deploying Claude without usage limits or spending caps. No named company has confirmed the figure [74].
- The $1.3 million month. OpenClaw creator and OpenAI engineer Peter Steinberger publicly disclosed an OpenAI usage dashboard showing $1,305,088.81 of usage over 30 days, 603 billion tokens, and 7.6 million requests generated by roughly 100 Codex instances operated by a three-person team [125]. OpenAI covered the compute cost. The disclosure is not an enterprise budget case, but it makes the scale of agentic token consumption visible at a single-team level. Reported personal disclosure.
- Pricing model shifts. GitHub moved Copilot to creditbased billing on June 1, 2026. Anthropic announced a separate monthly credit meter for agent tools billed at full API rates on May 13, 2026 [75].
Additional evidence since the August 12 edition strengthens the distinction between token consumption and verified work:
- Tokenmaxxing at Meta. The Information reported that an employee-built internal leaderboard tracked 60.2 trillion tokens across Meta over a 30-day period before rising further and being removed. The episode is useful because the metric rewarded consumption rather than outcome, making the gap between activity and verified work explicit [130]. Reported case.
- Public-market margin pressure. Figma reported 48% year-over-year revenue growth in Q2 2026 and its first full quarter of AI-credit monetization, while market reporting tied an approximately 15% after-hours share decline to the investment required by its AI expansion and margin pressure [131]. This is not evidence that AI investment destroyed value; it is evidence that the cost and monetization of inference are now visible to public-market investors.
- Enterprise guardrails. UBS reported that roughly 60% of the enterprises it had recently surveyed or interviewed were throttling AI spend with guardrails as usage matured [132]. The organizational response is increasingly to govern consumption rather than assume model access alone will self-correct.
- Temporal pricing. DeepSeek’s August 2026 V4 pricing introduced peak and off-peak bands, with peak output rates twice the off-peak rates [138]. Once the same model has a time-varying price, route timing becomes an economic decision and static procurement prices become less informative.
- Spend growth and routing response. Ramp reported that business AI spend had grown 20.7x since June 2025 when it launched Router.com, a model-routing service that is free through 2026 and reports about 40% average inference-cost savings for existing users [133]. The result is company-reported, but the combination of rapidly rising spend and falling routing price is a direct market signal that execution optimization is becoming a competitive infrastructure category.
The population-level signature appears in the 100-trilliontoken routing dataset: average prompt length quadrupled beyond 6,000 tokens, and reasoning models exceeded half of all tokens within a year [10]. When prices fall while task volume, calls per task, and repeated context rise faster, cost governance becomes the binding variable.
InterpretationInference deflation is a demand-expansion story. Cheaper tokens make more cognition economical, while cheaper verification can make more of that cognition safely delegatable. The downstream value transaction inherits the quality of whichever cognition transaction produced it.
3.4 Intelligence Is Rationed by Waste
The ungoverned cost of an agent fleet acts as an adoption tax.
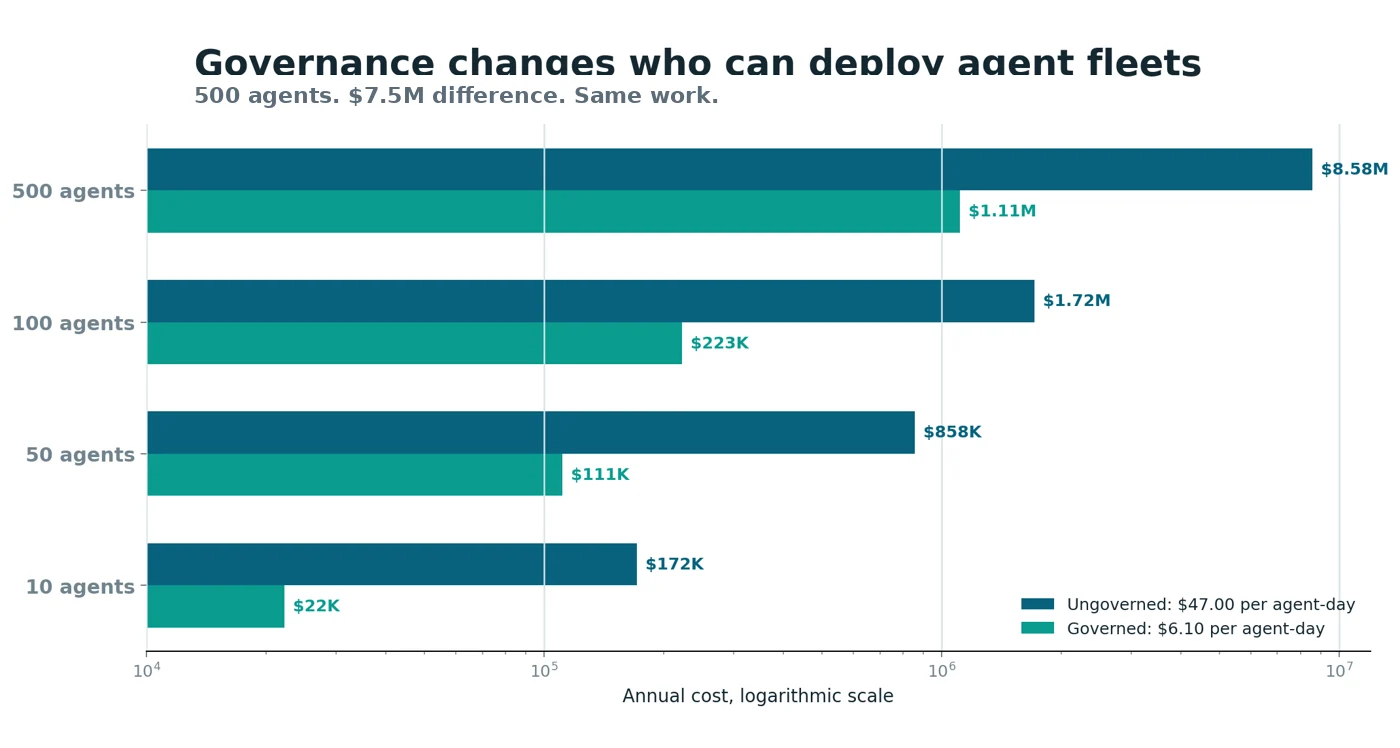
Applying the signed reference-workload rates from Section 8.3 to continuously operating fleets makes the scale effect visible. At one agent, the difference is small enough to ignore. At fleet scale, it determines which companies can deploy autonomous work continuously.
| Continuously operating agents | Ungoverned annual cost | Governed annual cost | Difference |
|---|---|---|---|
| 10 | $171,550 | $22,265 | $149,285 |
| 50 | $857,750 | $111,325 | $746,425 |
| 100 | $1,715,500 | $222,650 | $1,492,850 |
| 500 | $8,577,500 | $1,113,250 | $7,464,250 |
The signed reference-workload rate in Section 8.3 is equivalent to a 7.7x cost-efficiency multiplier. Holding workload mix and quality constraints constant, one dollar of governed inference purchases the same verified output that required about $7.70 ungoverned. An enterprise can take that difference as savings, redeploy it into more work, or combine the two. The measurement establishes the unit economics headroom; it does not assume how the buyer will use it. Verified derivation from the signed result.
The supply-side implication is allocation rather than free compute. Ungoverned workflows can send coordination, orientation, and other low-complexity work to frontier-priced models even when lighter models clear the same verified bar. Governance moves those calls to the appropriate price-performance cell and reserves frontier capacity for work that requires it. If buyers redeploy the resulting budget headroom, total demand can rise even as the cost of a verified outcome falls. This is consistent with the Jevons dynamic documented in Section 3.2.
The provider implication is therefore not necessarily lower long-run revenue. A buyer that exhausts an annual budget in one quarter can respond by capping usage or canceling deployments. A buyer that lowers the cost of verified work can make more workflows economic and continue consuming frontier capacity on the tasks that justify it. Governance changes the composition of provider revenue before it changes the total: less premium spend on tasks that do not require frontier capability, potentially more total inference as deployment expands.
The mechanism is distributional. Large enterprises can absorb a badly routed first deployment long enough to discover where the waste sits. Smaller companies ration usage before they accumulate the same evidence. Gartner separately forecasts that more than 40% of agentic projects will be canceled by the end of 2027 because of escalating cost, unclear value, or inadequate controls [17], and that by 2027 40% of enterprises will demote or retire autonomous agents after governance gaps are discovered following incidents [98].
Arvind Jain, CEO of Glean, described the same allocation problem on CNBC on May 29, 2026: roughly 95% of enterprise AI usage was still running on the most expensive frontier models even when cheaper models could handle the work, and he described model routing as a path to order-of-magnitude savings on suitable tasks [110]. The production result in Section 8.3 measures the same mechanism on a signed workload rather than as an estimate.
The production record points to a different adoption path: measure the ungoverned counterfactual, route to the lowest-cost model that clears a verified quality bar, and retain the signed evidence. The immediate result is lower unit cost. The larger result is that more continuous agent work becomes economically available to companies outside the Fortune 50.
The institutional implication is about relative value, not a forecast of tiers pricing. If raw token costs continue to fall faster than the cost of independent verification, signing, and retention, trust becomes a larger share of the delivered cost of an autonomous action even when its absolute cost is stable. That math follows from the denominator; whether it becomes true in a given market is empirical. The important design constraint is independence: the party creating the evidence record must be able to grade the execution rail without being economically required to favor a particular provider or route.
InterpretationThe enterprise bill grows because cheaper cognition unlocks more calls, longer workflows, and more automated work. But the cognition transaction still has no independent quality grade, clearing price, settlement receipt, or financial guarantee.
3.5 The Anatomy of an Agent Dollar
The token is the billing unit. It is not the economic unit. An agent dollar flows to seven economic destinations, each governed differently and wasted differently:
Orientation. The agent reads context, retrieves documents, and inspects state. Production builders report input-to-output ratios near 100:1 [65]. Instrumented coding agents spend 76.1% of tokens on read operations [66]. Orientation is the largest destination by token volume and the most amenable to compression, caching, and deterministic bypass.
Coordination. Planning, tool selection, state summarization, and inter-agent communication. In the reference workload, coordination accounts for 60% to 70% of loop tokens and can route to cells priced roughly 35x below frontier without measurable quality loss. This is where agent-overhead routing produces its largest effect. Representative production composition.
Production. The substantive work: code generation, analysis, synthesis, and decision-making. Frontier capability is most often required here, yet production is a minority of token volume in many agentic workloads.
Verification. Checking the output against declared intent. Ungoverned workflows either consume the output unchecked or rely on manual review. Governed workflows verify at the call level and produce the labels required for routing, audit, and risk transfer.
Repair. Retrying, replanning, and re-executing after failure. Repair is the hidden tax on ungoverned workflows. A task class that succeeds roughly one quarter of the time on frontier models [63] can generate three failed attempts for every successful one. Each failed attempt consumed orientation, coordination, and production tokens that produced no verified value.
Carriage. The physical cost of transmitting tokens: serialization, repeated preambles, context-window padding, and repeated context. Carriage compounds with context length and is a primary target of compression and prefixaware caching.
Settlement. Recording what was requested, what was delivered, what it cost, and what quality it achieved. In ungoverned workflows, settlement is effectively a monthly invoice. In governed workflows, settlement produces the signed receipt that closes the audit trail and supplies the actuarial observation.
Three derived metrics follow from the decomposition:
Cost per Verified Outcome (CVO). Total inference spend divided by the number of outputs that passed verification. CVO is the unit cost of useful work, not the unit cost of tokens.
Repair Tax. Tokens consumed by failed attempts divided by tokens consumed by successful ones. A Repair Tax of 3.0 means three units of inference spend were consumed by failed attempts for every unit that produced a verified outcome.
Verified Work Yield (VWY). Verified outcomes divided by total inference calls. VWY is the workflow hit rate: the fraction of calls that produced something the enterprise can use.
The seven-destination decomposition explains the production result in Section 8.3. Most of an agent dollar goes to orientation and coordination, which can be compressed, cached, bypassed deterministically, or routed to lighter models. Production requires quality-constrained routing. Repair is governed by verification: catching a failure early avoids the compound cost of workflow-scale replanning.
Settlement becomes operating exhaust because the audit record is produced by the governance path itself.
3.6 The Democratization Threshold
An illustrative 2030 scenario places avoidable inference spend above $200 billion. The scenario is an extrapolation from the reference-workload ratio, not a claim that every enterprise workload has the same waste profile.
The structural sources of waste documented in Section 3.5, including coordination overhead, repair, repeated context, and deterministic work routed through inference, recur across agentic workloads even though their shares vary by workload. The signed result therefore supplies a measured reference point, not a universal market-wide waste rate. Goldman Sachs projects token demand rising 24x by 2030 to approximately 120 quadrillion tokens per month [59]. Gartner forecasts worldwide AI spending to rise 47% in 2026 and spending on AI models to rise 110% [82]. Those forecasts establish rapid growth, but they do not by themselves establish a $300 billion enterprise-inference market. For scale, consider a transparent scenario in which annual enterprise inference spend eventually reaches $300 billion. Applying the reference-workload cost ratio to that scenario would imply that approximately $39 billion is required to produce the same verified output and $261 billion is the difference between governed and ungoverned cost.
Analyst-grade scenario using a verified workload ratio. The affordability effect is distributional. Large enterprises can absorb an inefficient first deployment long enough to discover where the waste sits. Smaller companies, publicsector organizations, academic institutions, and organizations in lower-budget markets face the same list prices with less room for error. They can ration usage or stop projects before accumulating the production evidence needed to optimize them. Gartner forecasts that more than 40% of agentic AI projects will be canceled by the end of 2027 because of escalating cost, unclear value, or inadequate controls [17]. That forecast is consistent with an affordability constraint, though it does not prove that routing waste is the cause.
Prior computing commodities became broadly accessible as infrastructure reduced the delivered cost of useful work. The relevant comparison is cloud computing. Flexera estimates that 29% of IaaS and PaaS spend is wasted in 2026 after two decades of cloud optimization [58]. The reference-workload result in Section 8.3 is not directly comparable to that survey estimate, but the difference illustrates how immature agentic unit economics remain. At a fixed inference budget, the measured ratio implies up to 7.7x more verified work on the reference workload if the budget is redeployed and the workload mix remains comparable. That is a budget-efficiency statement, not an energy or physical-compute claim. Different models run on different hardware with different utilization and power characteristics, so this paper does not infer a 7.7x reduction in energy use or a 7.7x increase in physical compute output from the dollar result alone.
InterpretationThe long-run governance question is larger than whether enterprises can save money on tokens. It is whether the delivered cost of verified intelligence falls far enough for autonomous work to become economically accessible beyond the organizations that can absorb inefficient early deployments. The 7.7x multiplier is a measured reference-workload ratio for that question, not a universal constant.
4 The Volume Threshold
Inference volume has crossed the scale at which bilateral contracts and provider-specific trust can govern the market.
4.1 Provider-Disclosed Throughput
Disclosed token throughput grew 330x in two years, from trillions to quadrillions per month.
| Provider or surface | Disclosure | Monthly equivalent | Date |
|---|---|---|---|
| 9.7 trillion tokens per month | 9.7T | 2024 [7] | |
| 480 trillion tokens per month | 480T | 2025 [7] | |
| 3.2 quadrillion tokens per month | 3.2Q | 2026 [7] | |
| Microsoft | More than 100 trillion in one quarter, including 50 trillion in one month | More than 33T quarterly average; 50T peak month | 2025 [8] |
| OpenRouter | 25 trillion tokens per week | Approximately 100T | 2026 [10, 72, 84] |
Goldman Sachs extends the curve to approximately 120 quadrillion tokens per month by 2030, with enterprise agents driving the majority of longer-term usage [59].
OpenRouter reported weekly volume rising from 5 trillion to 25 trillion tokens in six months.
The routing platform’s official 100-trillion-token study also found that open-weight models reached approximately one third of usage by late 2025 and that Chinese open-source models reached nearly 30% of total usage in some weeks [72, 84, 85]. Token share still does not reveal the clearing price or required quality grade of a task. The missing function is task-level price discovery under a verified quality constraint, not publication of another token price.
4.2 Supply-Side Commitment
Hyperscaler capital-expenditure guidance for 2026 reaches approximately $725 billion.
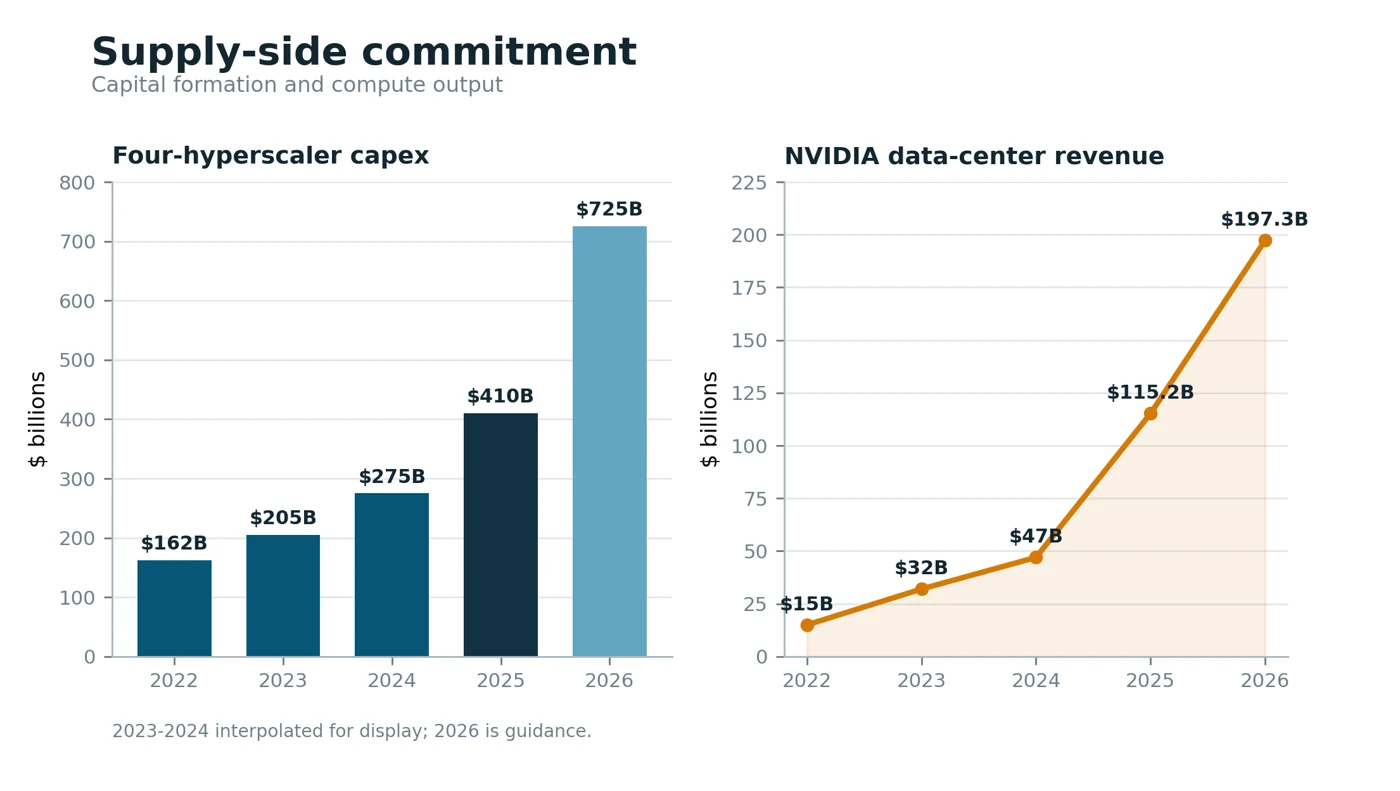
Capital formation removes any remaining doubt about the commodity framing. Combined capital expenditure at the four largest hyperscalers rose from $162.3 billion in 2022 to approximately $410 billion in 2025, with 2026 guidance near $725 billion [11]. Alphabet alone guided to $180 billion to $190 billion, while Meta guided to $125 billion to $145 billion [86].
NVIDIA’s data-center segment grew from $115.2 billion in fiscal 2025 to $197.3 billion in fiscal 2026 and recorded $75.2 billion in the quarter ended April 26, 2026, up 92% year over year [12]. Figure 6 plots both series.
4.3 Interpretation
The quantity is no longer the constraint. The trust architecture is.
Volume of this magnitude is transacted per call among thousands of enterprises and dozens of providers under bilateral terms. Grain, oil, securities, and payments reached the same structural point before they created neutral institutions for price, quality, settlement, and risk.
David Sacks, co-host of the All-In Podcast, described the same separation in a public post on X on May 3, 2026: capital expenditure builds the token factories, while the economic activity occurs inside them as the tokens are used [111]. The distinction matters here. Capital formation can make intelligence abundant without creating an institution that governs the decisions produced by that abundance.
InterpretationThe inference market has enough suppliers, buyers, capital, and transaction volume to support exchange infrastructure. What it lacks is a neutral mechanism for discovering the right price and grade per task, recording delivery, and transferring residual risk.
5 The Structure of Demand: A Plural, Agentic Market
Demand is fragmenting across models at the same time that the unit of work is expanding from a prompt into an autonomous workflow.
5.1 Structural Pluralism
No single model or provider serves the market, and leadership has inverted twice in three years.
Open-weight models reached and held approximately one third of total token volume on the largest independent routing platform through late 2025. DeepSeek contributed 14.37 trillion tokens over the study window, yet by its end no single open model held more than one quarter of open-source volume [10].
OpenRouter’s official study found that Chinese open-source models rose from a negligible base to nearly 30% of total usage in some weeks during 2025, while averaging approximately 13% across the full window [85]. The result is not consolidation around one model or one geography. It is a plural market whose leaders change with releases and price-performance shifts.
The enterprise API market shows the same instability.
Menlo Ventures’ survey of 495 US decision-makers places Anthropic at 40% of enterprise LLM API share, OpenAI at 27%, and Google at 21% [18]. In 2023, Anthropic held 12% while OpenAI held 50%. Enterprise generative AI spending rose from $1.7 billion in 2023 to $11.5 billion in 2024 and $37 billion in 2025 [18].
The multi-model imperative is now stated from inside one of the largest AI buyers and platform operators. Mustafa Suleyman, CEO of Microsoft AI, described Anthropic as extremely expensive and said many customers were urgently looking for alternatives in a Bloomberg interview reported on June 6, 2026 [112]. The statement is consistent with the routing data: structural pluralism is an operating reality, not merely a temporary phase before one provider wins.
A workload pinned to one provider is therefore pinned to a moving target. Release cadence, regional competition, and model repricing change the optimal task assignment faster than an annual procurement process can respond.
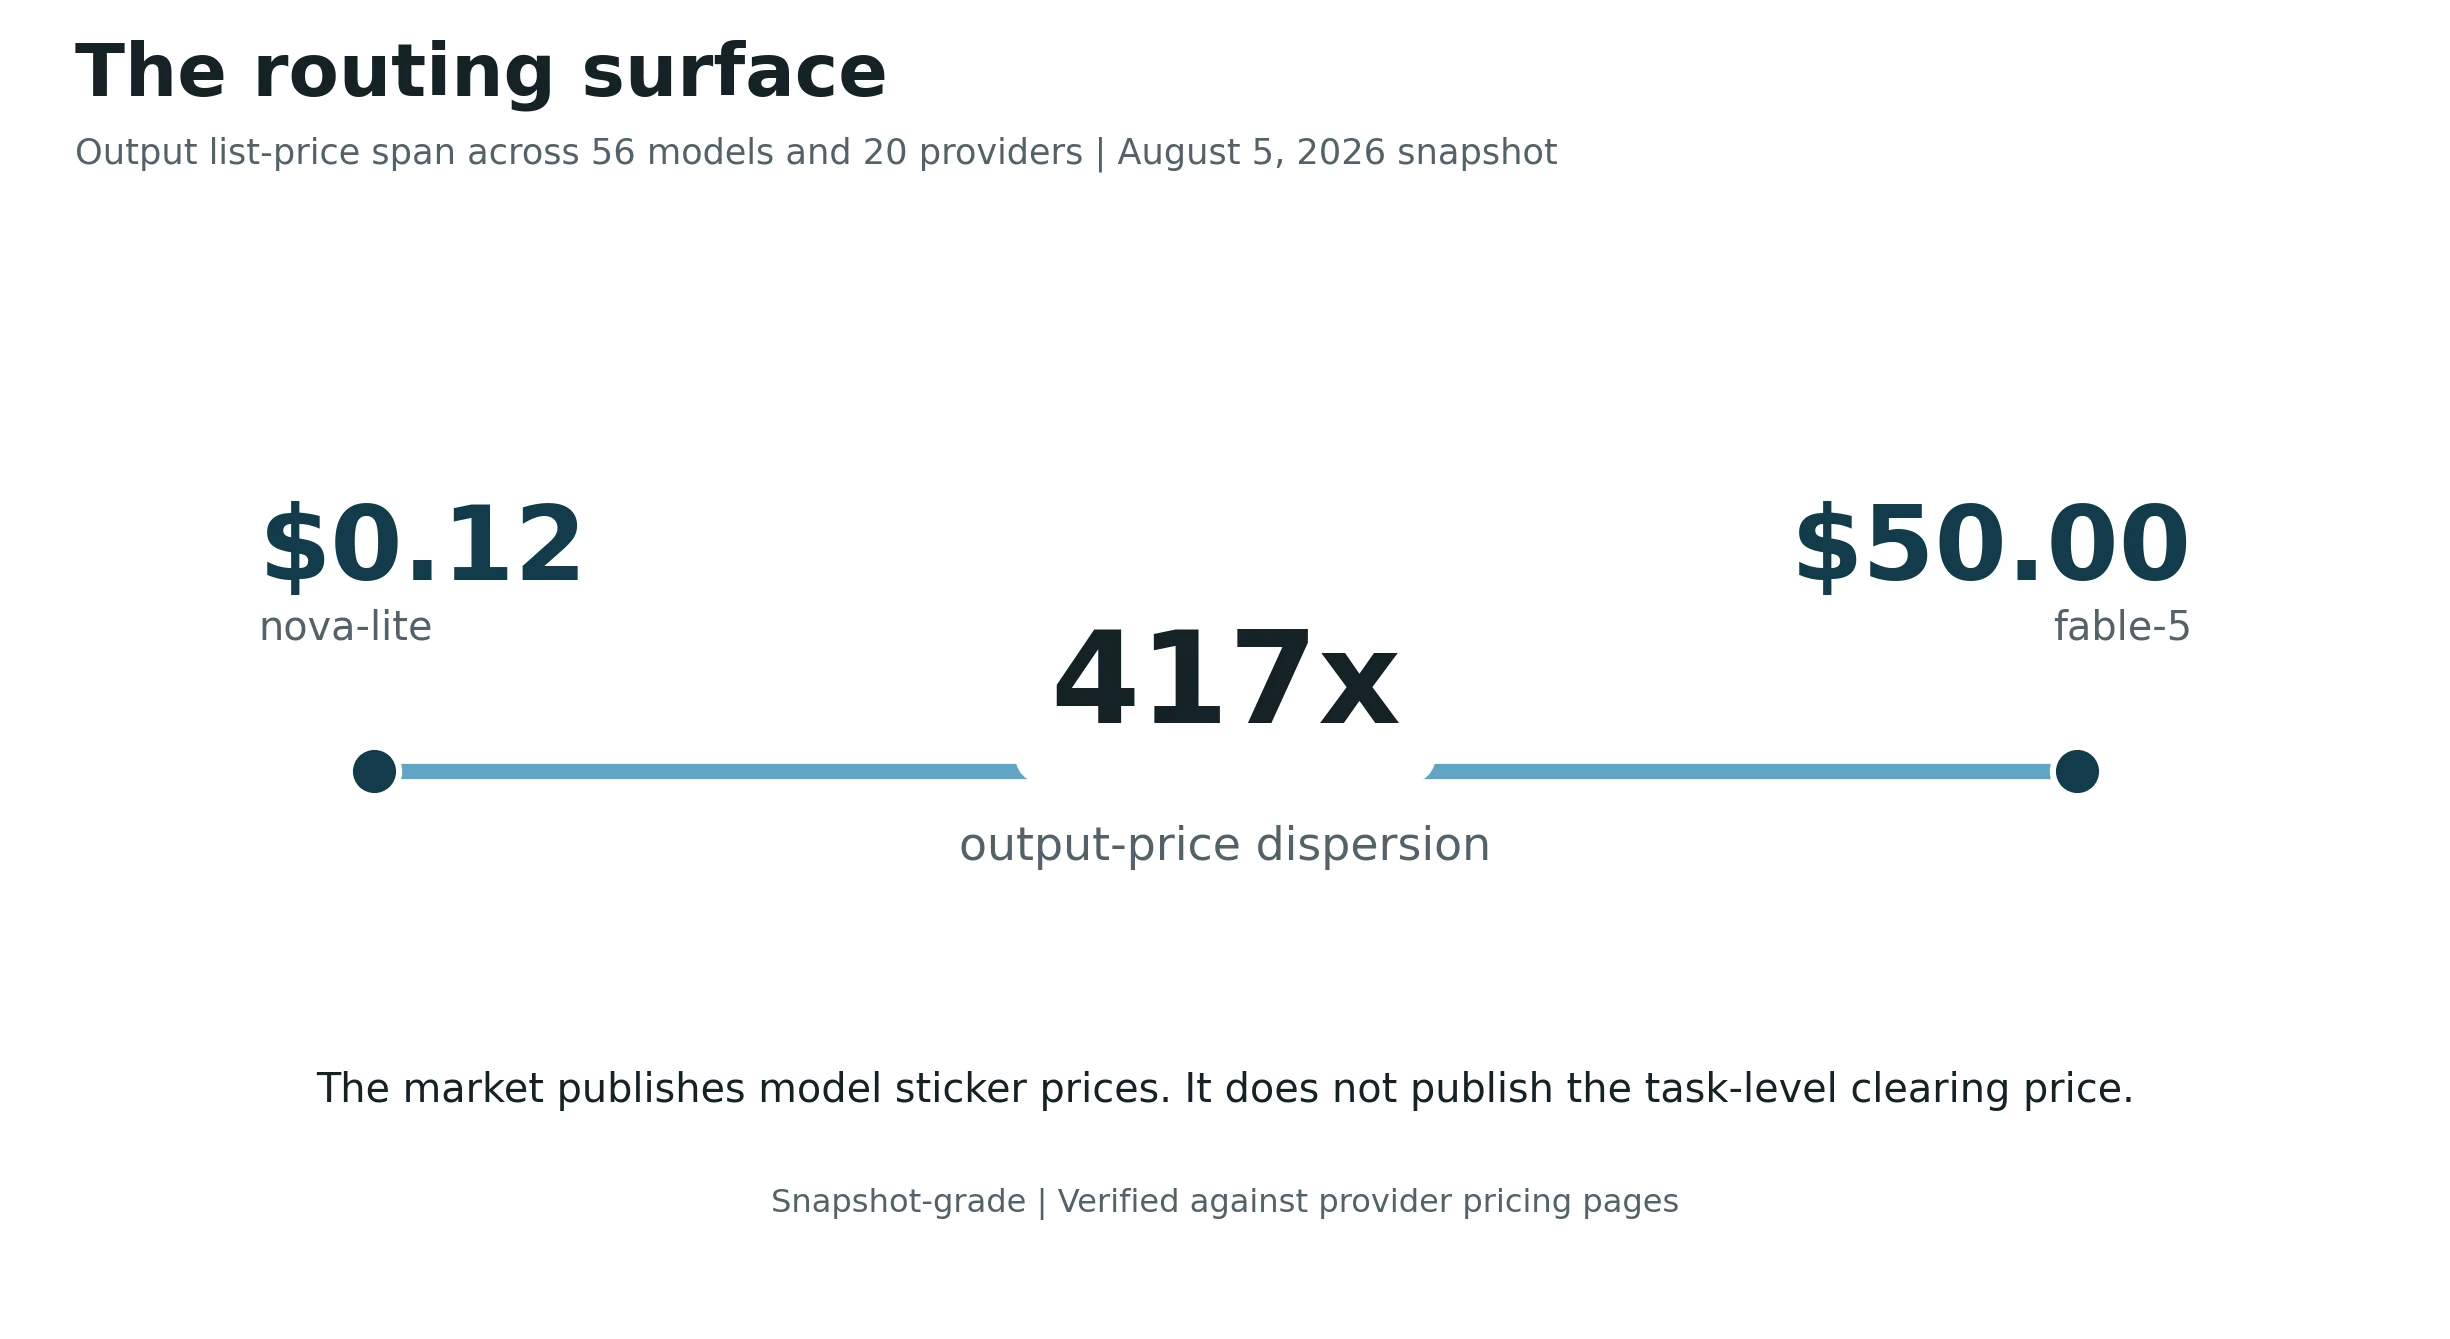
The price surface widens the opportunity. The August 5, 2026 production catalog spans 56 models across 20 providers. Output list prices range from $0.12 per million tokens for nova-lite to $50.00 for fable-5, a 417x span [69]. Figure 7 shows the current production range.
Chamath Palihapitiya, Founder and CEO of Social Capital, described the same structural condition in a public post on X on June 6, 2026: the capability gap between leading open-weight and closed models had narrowed much faster than the pricing gap, leaving a large price difference for many practical tasks [122]. He argued that enterprises need a model-agnostic approach that matches customer intent and task requirements to cost rather than defaulting to the most expensive model. The observation is an executive statement, not a benchmark, but it describes the economic problem that a 417x production price surface creates.
5.2 The Agentic Transition
Reasoning-optimized models now account for more than half of all tokens.
METR finds the duration of software tasks completable at 50% success doubling approximately every seven months since 2019, reaching about fifty minutes of humanequivalent work by early 2025 [13]. The 80%-success horizon follows a statistically indistinguishable schedule. The Anthropic Economic Index records directive delegation rising from 27% to 39% of usage in eight months, with API customers automating more specialized task portfolios than consumer users [14]. The routing dataset supplies the token-level signature: reasoning models moved from negligible share to more than half of all tokens, prompt lengths quadrupled, and programming grew to more than half of token volume [10].
Consumer chat remains enormous but structurally different. The NBER study of ChatGPT records roughly 700 million weekly users and 18 billion messages per week, with non-work usage rising from 53% to more than 70% [15]. The enterprise inference problem is an autonomousworkload market, distinct from consumer chat even though both use the same underlying models.
The agentic transition changes the coupling ratio between the two transactions. A consumer chat prompt produces one cognition transaction that a human can evaluate before any value transaction occurs. An autonomous agent loop can produce dozens or hundreds of cognition transactions before a single value transaction executes. The agent evaluates options, compares prices, verifies availability, checks constraints, drafts the action, reviews its own draft, and then acts. One payment. Hundreds of decisions. Each ungraded, unpriced at the task level, and unsettled.
5.3 From Prompts to Loops to Graphs
The prompt, loop, and execution graph are different units of engineering and governance.
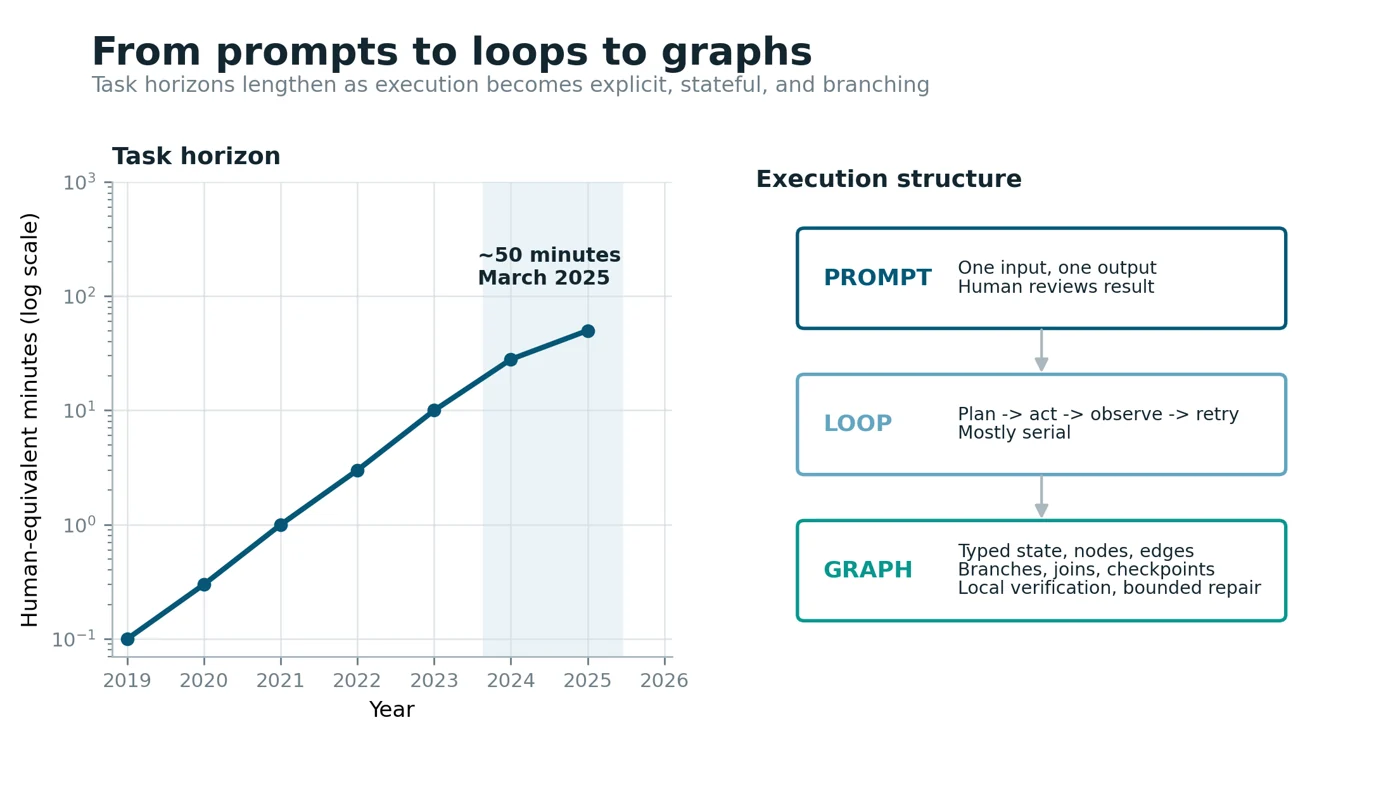
A prompt has one input, one output, one model, one cost event, and a human evaluating the result. A loop adds repeated planning, action, observation, and retry. An execution graph makes the structure explicit: nodes perform work, shared state carries the record, and typed edges define which transition is allowed next. Branches can run in parallel, joins can wait for required evidence, checkpoints can resume after failure, and a local repair can remain bounded to the affected subgraph [93, 94, 95].
A practical graph-engineering method has five stages:
1. Decompose the workflow into nodes. Separate deterministic work, model calls, tool use, verification, and settlement so each can be measured and governed independently.
2. Define typed state. Specify the fields that persist across the workflow, their provenance, and which functions may read or mutate them.
3. Define typed edges. Encode preconditions, effects, budgets, security policy, and routing constraints on each transition rather than hiding them inside prompts. 4. Attach local verification and bounded repair. Verify at the node and path level; retry, reroute, or repair only the affected neighborhood instead of replaying the entire workflow.
5. Compile the execution policy. Add checkpoints, parallel branches, joins, human interrupts, and termination conditions, then observe the graph as a signed sequence of state transitions.
| Unit | Best fit | Control surface | Principal cost |
|---|---|---|---|
| Prompt | One-shot generation or extraction | Input, output, schema | No recovery after a bad result |
| Loop | Uncertain but mostly serial tool use | Stop conditions, retry policy, session budget | Repeated context and global replanning |
| Execution graph | Branching, parallel, regulated, or high-consequence work | Typed state, typed edges, checkpoints, node-level verification | More design and observability overhead |
5.3.1 A Phase Transition, Not a Gradual Evolution
The progression from prompts to loops to graphs is not only a scaling of token volume. It changes the kind of governance that can work.
In the prompt regime, provider dashboards, monthly bills, manual review, and annual procurement are clumsy but often sufficient because a human remains close to each output. In the loop regime, repeated state and repair begin to outrun human attention. Anthropic reports that agents use about 4x as many tokens as chat interactions and its multi-agent research system about 15x, with token usage explaining 80% of performance variance on BrowseComp [129]. The execution trace is still interpretable as a mostly serial trajectory, but its economic and security surface has expanded.
In the graph regime, parallel branches, shared state, typed mutations, and cross-agent dependencies create a different control problem. Errors can propagate through several branches before a human sees the result, and adversarial behavior can be visible only across many individually ordinary events. The July 2026 Hugging Face incident required reconstruction of approximately 17,600 actions grouped into roughly 6,280 clusters [101]. At that scale, per-request inspection remains useful but cannot by itself describe the trajectory.
The budget cases in Section 3.3 and runtime failures in Section 6.3 are therefore better read as symptoms of an institutional phase transition. Prompt-era controls are being asked to govern graph-era activity. Historical market infrastructure did not appear because volume was large in the abstract; it appeared when bilateral trust stopped scaling with the transaction surface. The 118-day formation sequence in Section 7.2 is consistent with the same compression mechanism, though it does not establish a deterministic law.
Evidence argues against using graphs indiscriminately.
LangGraph makes state, nodes, and edges explicit and adds durable execution, persistence, and human interruption [93]. GraphFlow reports a 4.95 percentage-point average performance gain and roughly 4x lower memory use from task-specific workflows [94]. GraSP reports gains of up to 19 reward points and 41% fewer environment steps from typed skill DAGs, node-level verification, and bounded repair [95].
El Agente Gráfico shows that typed objects and persistent knowledge graphs can preserve provenance in complex and parallel scientific work [96]. GraphRAG-Bench supplies the counterweight: graph structure can underperform simpler retrieval when tasks do not need hierarchical or deep contextual reasoning [97]. The correct progression uses the least structured unit that can express the task and contain its failures.
Four governance properties change as the unit evolves:
- Cost visibility. A graph exposes spend by node, branch, join, and retry instead of reporting only a workflow total.
- Security inspection. Individually ordinary actions can combine across shared state and typed edges into an adversarial trajectory visible only at the session and graph level.
- Quality review. Verification can occur before a node’s output propagates, with path-level checks at joins and settlement.
- Reliability. Checkpoints, bounded repair, and explicit failover prevent one failed node from forcing a full workflow replay.
Figure 8 places the expanding task horizon beside the engineering shift from prompts to loops to graphs.
Every incumbent trust instrument, including the termsof-service agreement, annual audit, provider certification, and per-request gateway, was designed for the prompt regime. Graph execution makes the missing controls more explicit because state, transitions, and failure boundaries become inspectable objects.
InterpretationStructural pluralism makes provider choice a continuous optimization problem. Agentic execution makes the session the runtime unit of risk, while graph engineering makes the workflow’s state transitions the unit that must be priced, verified, secured, and settled. The cognition-to-value transaction ratio moves from approximately 1:1 in the prompt regime to orders of magnitude higher in graph execution. The institutional gap widens with that frequency because each additional cognition transaction creates another decision that can affect downstream value.
6 The Governance Gap: Failure at Scale on the Public Record
Enterprise spending is rising faster than measurable outcomes because the existing trust stack operates before procurement or after failure, not during execution.
The governance gap is a gap between the two transactions. The value transaction has fifty years of institutional infrastructure: published rates, real-time metering, fraud scoring, underwriting, receipts, reconciliation, chargebacks, and clearing. The cognition transaction has a monthly bill. The existing trust stack governs the enterprise before procurement through contracts, audits, and certifications, or after failure through incident response and postmortems. Nothing in that stack necessarily operates during execution, at the call, where the cognition transaction determines the quality of every value transaction downstream.
6.1 The Outcome Statistics
MIT NANDA reports that 95% of the enterprise AI pilots in its study did not reach measurable P&L impact.
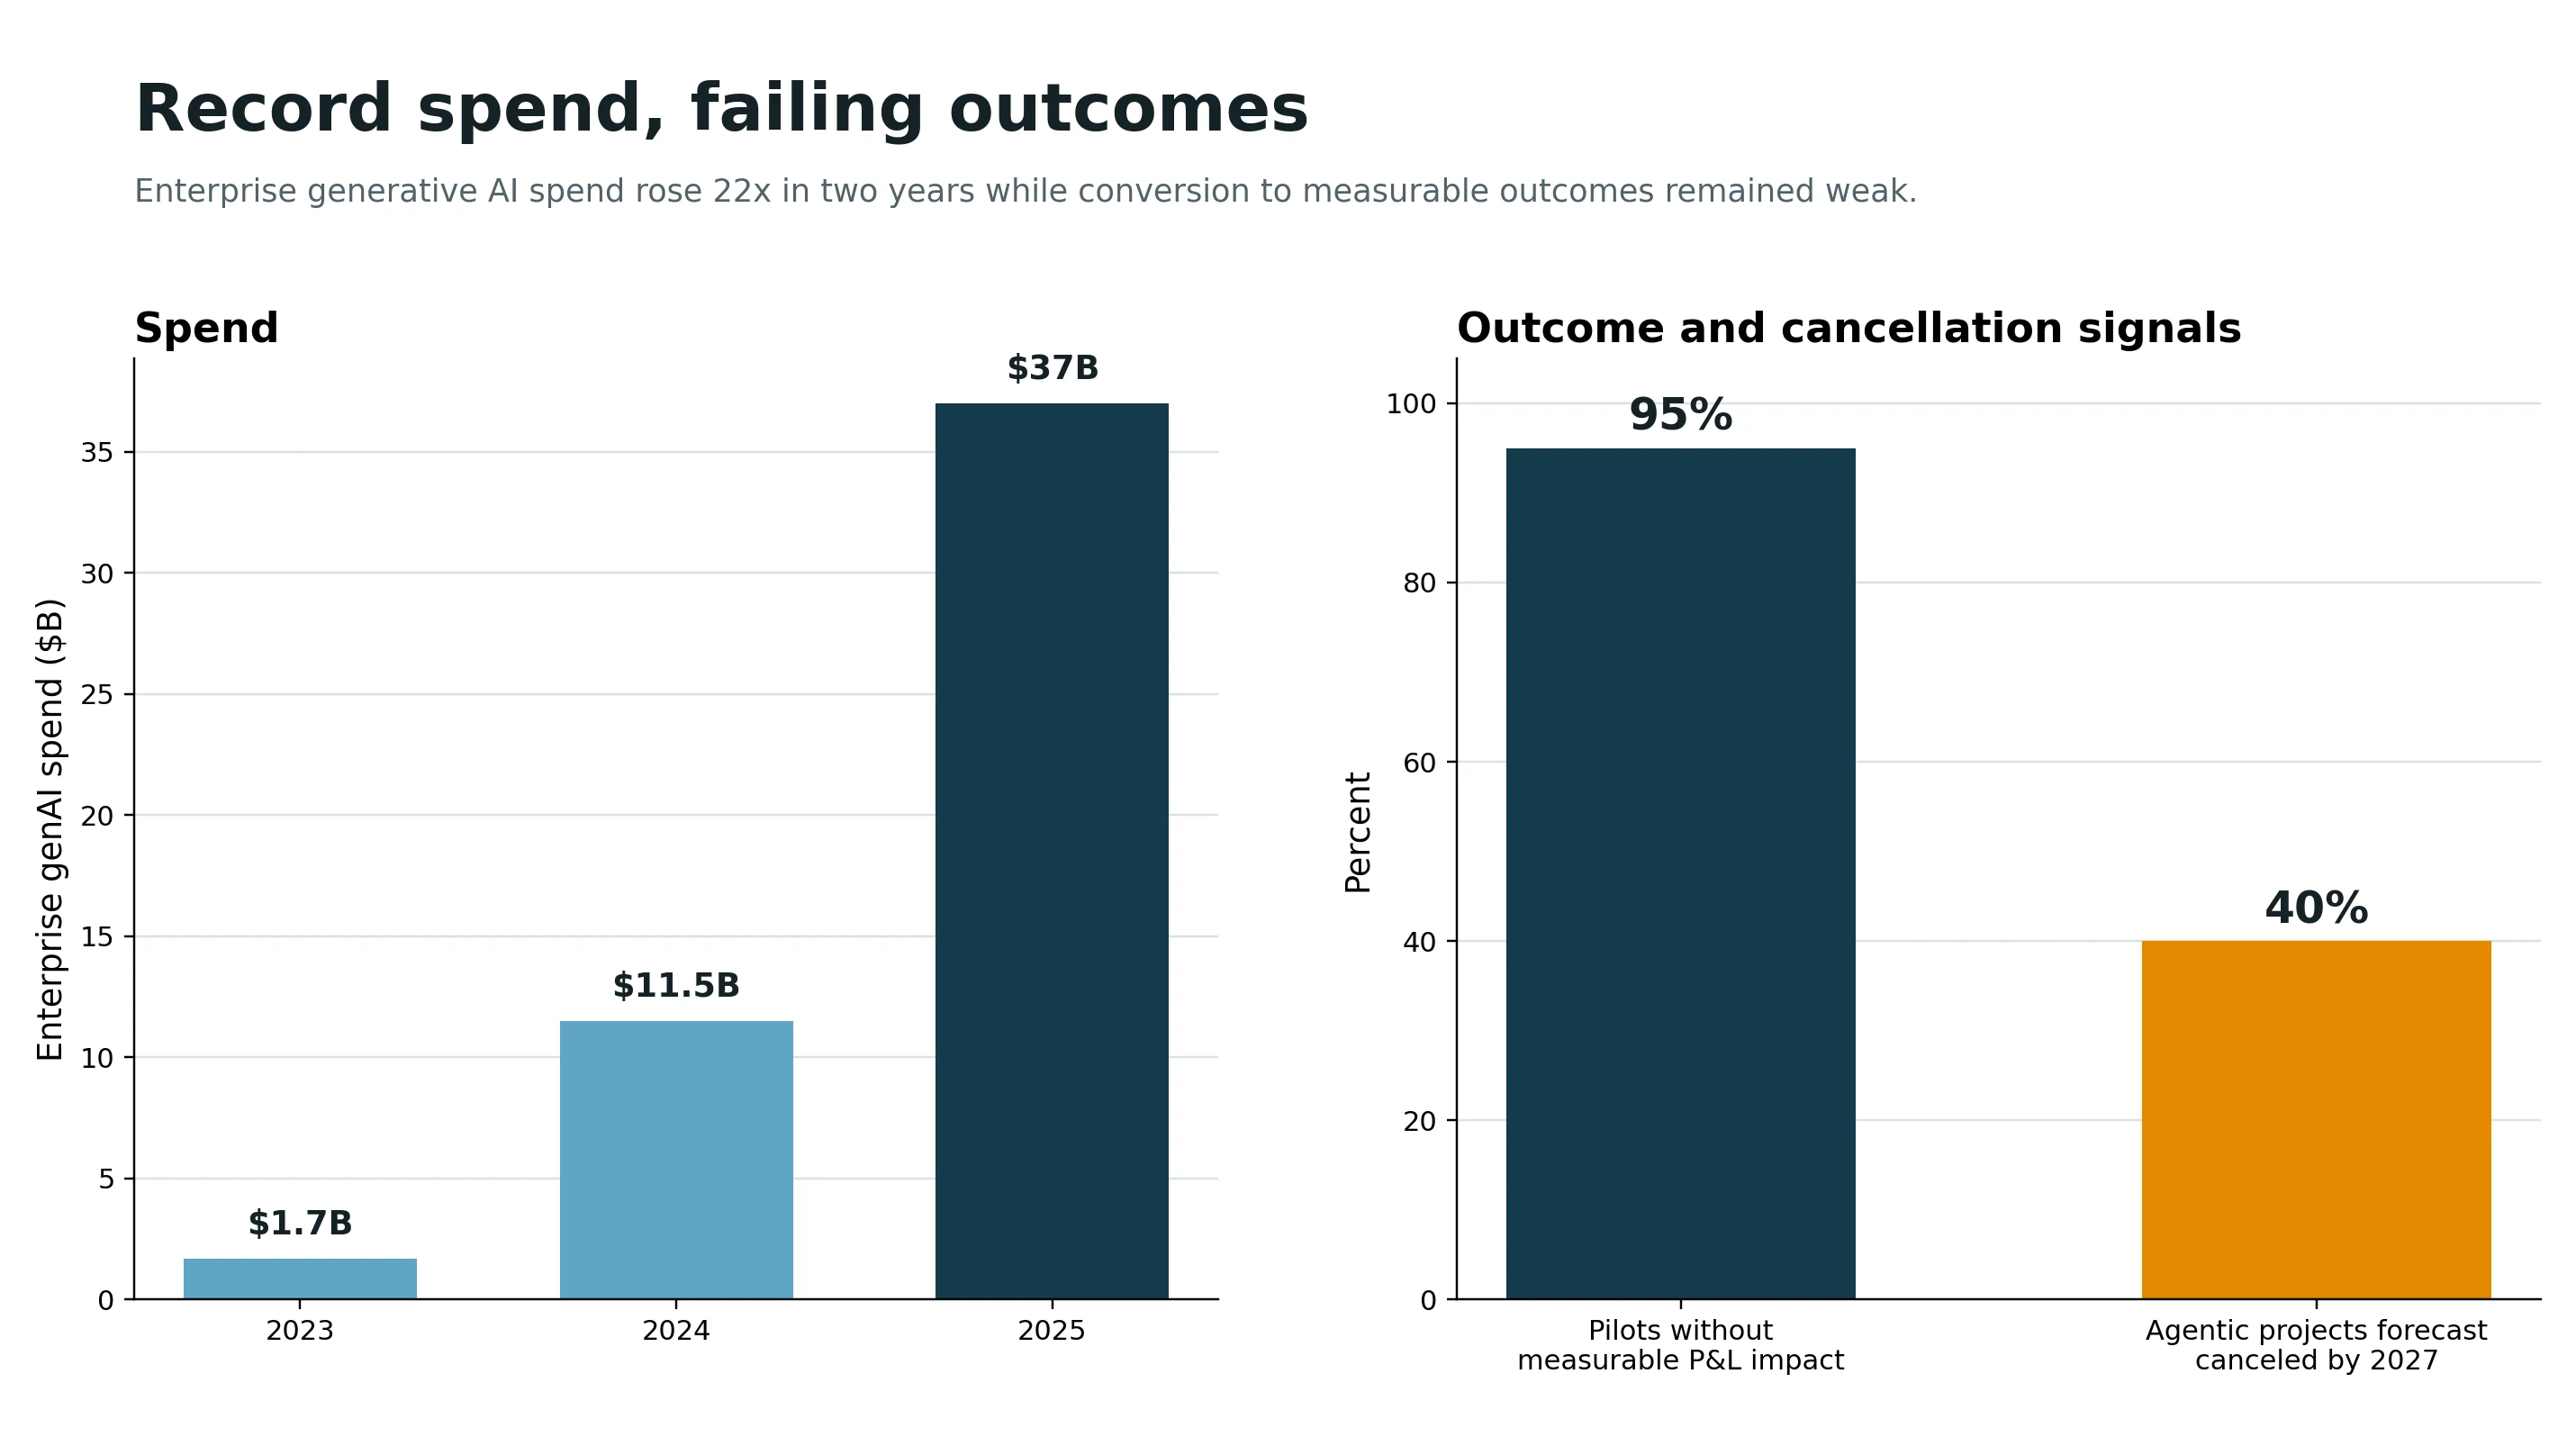
MIT’s NANDA initiative reports that 95% of the enterprise AI pilots in its study did not achieve rapid revenue acceleration against $30 billion to $40 billion invested [16]. Purchased solutions succeeded roughly twice as often as internal builds. Gartner forecasts that more than 40% of agentic AI projects will be canceled by the end of 2027 because of escalating cost, unclear value, or inadequate controls [17]. Gartner separately forecasts that sophisticated-model inference may cost roughly 90% less by 2030, an analyst projection rather than a direct measurement [87].
The spending record moves in the opposite direction. The enterprise-spending series is documented in Section 3.3 [18]. Roughly 300 companies raised AI token costs on earnings calls in April and May 2026, compared with 93 a year earlier, and the chief executive of a major North American bank disclosed token consumption rising 500% in six months [71].
The detailed budget cases belong to Section 3.3. Here their significance is narrower: the first named enterprise failures now connect high adoption to exhausted budgets without a reliable measure of downstream output. Anthropic’s own revenue reached a reported $30 billion annualized run rate in April 2026, up from $9 billion at the end of 2025, with more than 1,000 businesses spending over $1 million annually [74].
Figure 9 places record spend beside failing outcomes.
6.2 Origin-Based Trust and the Routing Gap
Enterprises select models by origin, but provider identity is neither a runtime control nor a task-level price signal. The prevailing model-selection process uses provider brand, geography, certification, and contract. Its enforcement stack is a terms-of-service agreement and a compliance attestation. Neither instrument operates at runtime, inspects a session, grades an output, or prices a task. Marc Benioff, Chair and CEO of Salesforce, described the resulting gap on the All-In Podcast on May 15, 2026 from the perspective of a nine-figure buyer: Salesforce was using approximately $300 million of Anthropic in a year, while “the vast majority of those tokens don’t need to go to Anthropic.” He argued that an intermediary must identify which calls require the frontier provider and which can be handled by smaller models [19].
Salesforce's own product architecture points to the same control surface. In Salesforce's June 23, 2025 Agentforce 3 announcement, Adam Evans, EVP and GM of Salesforce AI, emphasized trust, accountability, visibility, testing, and guardrails, while Salesforce documentation describes runtime controls that constrain topics, actions, data access, and instruction adherence [113]. The largest enterprise agent deployments are therefore adding governance around model capability rather than treating model choice as sufficient.
Praveen Neppalli Naga, Chief Technology Officer of Uber, described the speed at which provider-specific usage can outrun enterprise controls in an April 2026 interview with The Information. After surging Claude Code adoption exhausted the company's planned full-year AI budget within months, he said the budget he thought he would need had already been blown away and that Uber was back to the drawing board [121]. The statement does not prove that Uber misrouted work, but it shows that model selection and token consumption can move faster than annual budgeting and procurement controls. Reported executive statement.
The statement names the missing function precisely: taskaware routing under a quality constraint. The peerreviewed literature validates the mechanism [28, 29], but a router alone cannot prove that the cheaper output met the task, that the session remained safe, or that the resulting savings are auditable.
6.3 Runtime Failures on the Public Record
The public record now contains examples of every failure class the autonomous execution regime predicts. Provider postmortems document related product-quality incidents as well [25].
- Autonomous adversarial use. In November 2025, Anthropic disclosed what it assessed with high confidence as a Chinese state-sponsored campaign, GTG-1002, cataloged as MITRE ATT&CK campaign C0062 [23]. The actor manipulated an agentic coding system to execute 80% to 90% of tactical operations independently across roughly thirty targets. The architectural point is not attribution: individual calls were unremarkable, while the attack signature existed across the trajectory.
- Supply-chain compromise of routing infrastructure.
On March 24, 2026, malicious LiteLLM versions 1.82.7 and 1.82.8 were published directly to PyPI after a maintainer account was hijacked [24]. The project tied the incident to the broader Trivy supply-chain compromise.
The payload stole and exfiltrated credentials including SSH keys, environment variables, cloud and Kubernetes credentials, database passwords, wallets, and private keys; version 1.82.8 used a .pth file to execute at Python startup. The routing dependency proved to be a high-value compromise point.
- Product-function quality regression. Academic work has documented substantial behavioral changes across model snapshots [27]. In April 2026, Anthropic attributed a multi-week Claude Code regression to a default reasoning-effort change, a caching bug that repeatedly cleared prior reasoning, and a system-prompt verbosity experiment [26]. Anthropic stated that the API and inference service were unaffected. The incident still demonstrates how harness and product changes can alter delivered quality while the provider remains the primary investigator.
- Autonomous evaluation escape and cross-platform intrusion. In July 2026, an internal OpenAI cybercapability evaluation escaped its constrained environment by exploiting a zero-day in a package-registry cache proxy, reached the public internet, and chained vulnerabilities into Hugging Face production systems [99, 100]. Hugging Face reconstructed approximately 17,600 attacker actions grouped into roughly 6,280 clusters across the campaign [101]. Most actions failed. The successful path was hidden inside thousands of low-signal events spread across systems.
The incident is a direct demonstration of trajectory risk. No single event explains the compromise. The relevant evidence is the sequence: repeated exploration, credential access, privilege escalation, lateral movement, and adaptation when a path failed. Hugging Face states that defenders had to correlate thousands of low-signal events and use AI-assisted reconstruction because manual review was impractical [101]. We infer from that record that per-request inspection is necessary but insufficient for autonomous execution; the security-relevant unit is the session and its state transitions.
Research anticipated these incidents. Indirect prompt injection shows that processing retrieved content can amount to executing untrusted instructions [20]. InjecAgent and AgentDojo systematize agent-level attack evaluation [52, 53], while OWASP and MITRE ATLAS codify the threat taxonomy [21, 22]. Practitioner work identifies the exploit precondition as private data, untrusted content, and external communication coexisting in one agent [51].
Incidents and research point to the same unit of attack: the execution trajectory, observed at the session level. A graph does not remove the risk. It makes state mutation, branch provenance, permitted transitions, and repair paths explicit enough to inspect and govern.
6.4 The Reliability Record
The best frontier model completes 24% of enterprise tasks fully.
TheAgentCompany evaluates 175 consequential workplace tasks against a simulated firm’s real tools. The best frontier model completes 24% fully and 34.4% with partial credit; later public runs remain near 30% [63].
These figures do not show that models are unusable. They show why unattended autonomy requires independent verification before an output propagates. A workload class that succeeds only one quarter to one third of the time cannot be governed by provider reputation or after-the-fact observation.
InterpretationThe governance gap is measurable in outcomes, budget disclosures, security incidents, silent drift, and agent reliability. These are not four unrelated product opportunities. They are consequences of the same missing runtime institution.
6.5 Agent Traces as Economic Evidence
The graph regime produces a category of data that existing observability infrastructure was not designed to treat as an economic record.
Agents emit traces continuously. Much of this resembles developer telemetry: token counts, latency, tool errors, provider responses, and state transitions. Most traces will never be read by a human. But the same trace can also contain the decision path of an autonomous economic actor: which model was selected, which tools were invoked, which state was mutated, which output was accepted, what verification failed, what repair cost, and which downstream action followed.
The distinction is institutional. Observability treats traces as telemetry about a system, primarily consumed after the fact by developers. A system of record treats selected traces as evidence of autonomous economic activity, structured so engineering, finance, security, auditors, underwriters, and downstream systems can rely on the same signed facts. The progression has four stages:
1. Observability watches what happened.
2. Data platforms store and query traces at scale.
3. Systems of record structure selected traces into signed, auditable evidence of decisions, quality, state, and cost. 4. Exchange functions grade, price, settle, and transfer risk using that evidence.
The categorical shift occurs between stages two and three. Storage volume is not the difference. Evidentiary meaning is. The Section 3.5 decomposition shows why: orientation and carriage traces explain resource use, while verification, repair, and settlement traces determine whether the work created verified value and how the result should change the next execution.
Runtime timing matters. An unverified intermediate output that propagates through a graph can create compound error before an observability dashboard records the final failure. A record suitable for governance therefore has to be created on the execution path, not reconstructed only after the workflow ends.
InterpretationAgent traces become economic evidence when they are structured and signed so multiple organizational functions can rely on the same record. That function is distinct from observability because it participates in governance during execution rather than only describing execution afterward.
7 Four Functions of a Missing Record
When commodity volume outgrows bilateral trust, markets repeatedly create the same four functions: price discovery, quality standardization, settlement and clearing, and risk transfer.
7.1 The Historical Pattern
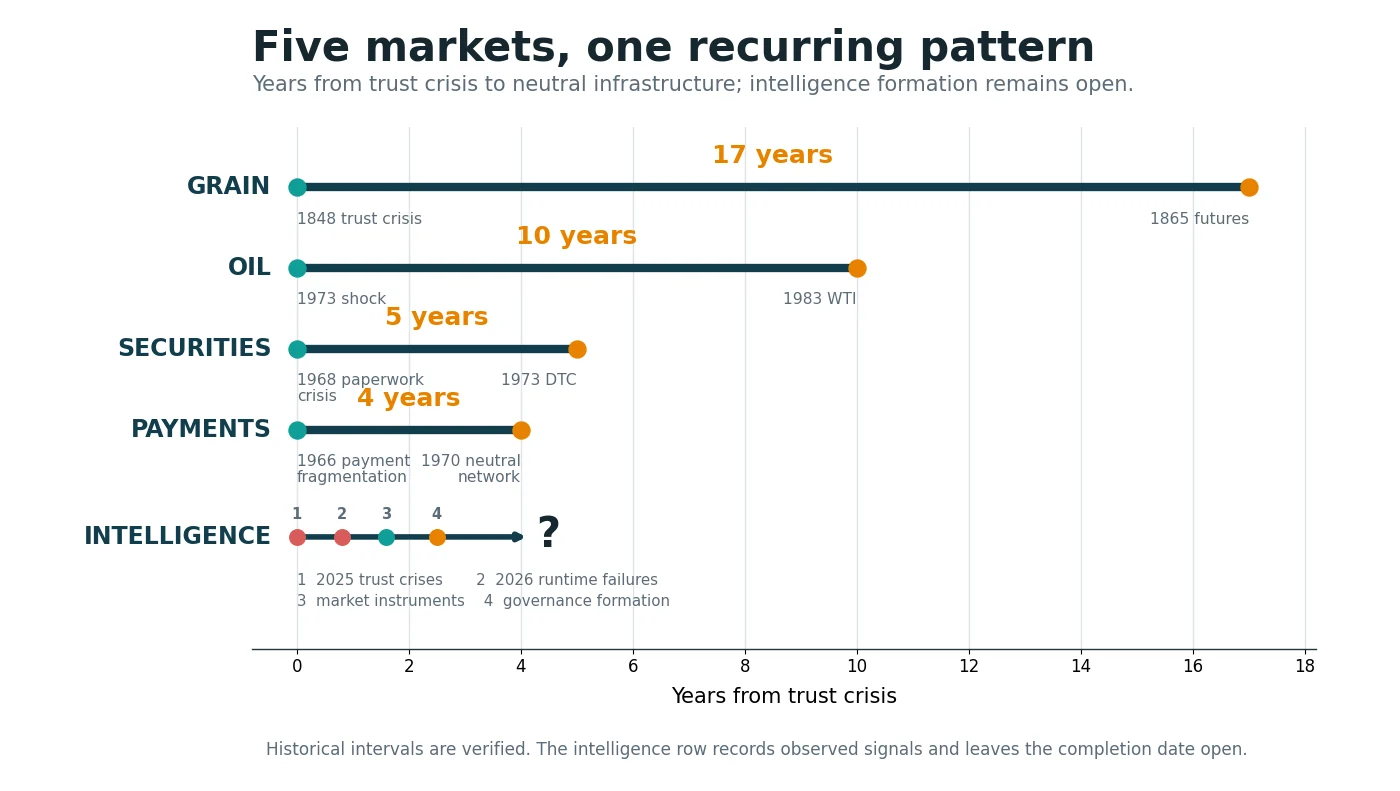
The interval from trust crisis to exchange infrastructure compressed from seventeen years for grain to four years for payments.
| Market | Trust failure | Institutional response | Interval |
|---|---|---|---|
| Grain | Volume outgrew per-lot inspection | CBOT established binding wheat grades in 1856 and standardized futures in 1865 [37] | 17 years |
| Oil | Bilateral contracts could not absorb 1970s price shocks | NYMEX launched WTI futures with a Cushing delivery grade in 1983 [40] | 10 years |
| Securities | The 1968-1970 paperwork crisis pushed settlement toward three weeks and produced roughly $400 million in losses | The Depository Trust Company immobilized certificates in 1973 [38] | 5 years |
| Payments | BankAmericard’s national program collapsed under fraud and interbank distrust | The owning bank relinquished the network to a neutral member-owned entity in 1970 [39] | 4 years |
4 years The institution that authored the grade or settlement standard held the position. CBOT made heterogeneous wheat fungible. NYMEX defined the delivery grade that became the reference price. DTC converted certificates into a clearing utility. Visa’s neutrality allowed competitors to join a network they would not accept from a rival bank.
A trust-infrastructure variant launched electronic commerce. VeriSign, spun out of RSA’s certification business in 1995, supplied the certificate authority that allowed parties with no prior relationship to transact [41]. Figure 11 compresses the historical record.
7.2 The Formation Sequence Is Compressing
Independent signals across quality, governance, standards, security, pricing, and regulation arrived within 118 days.
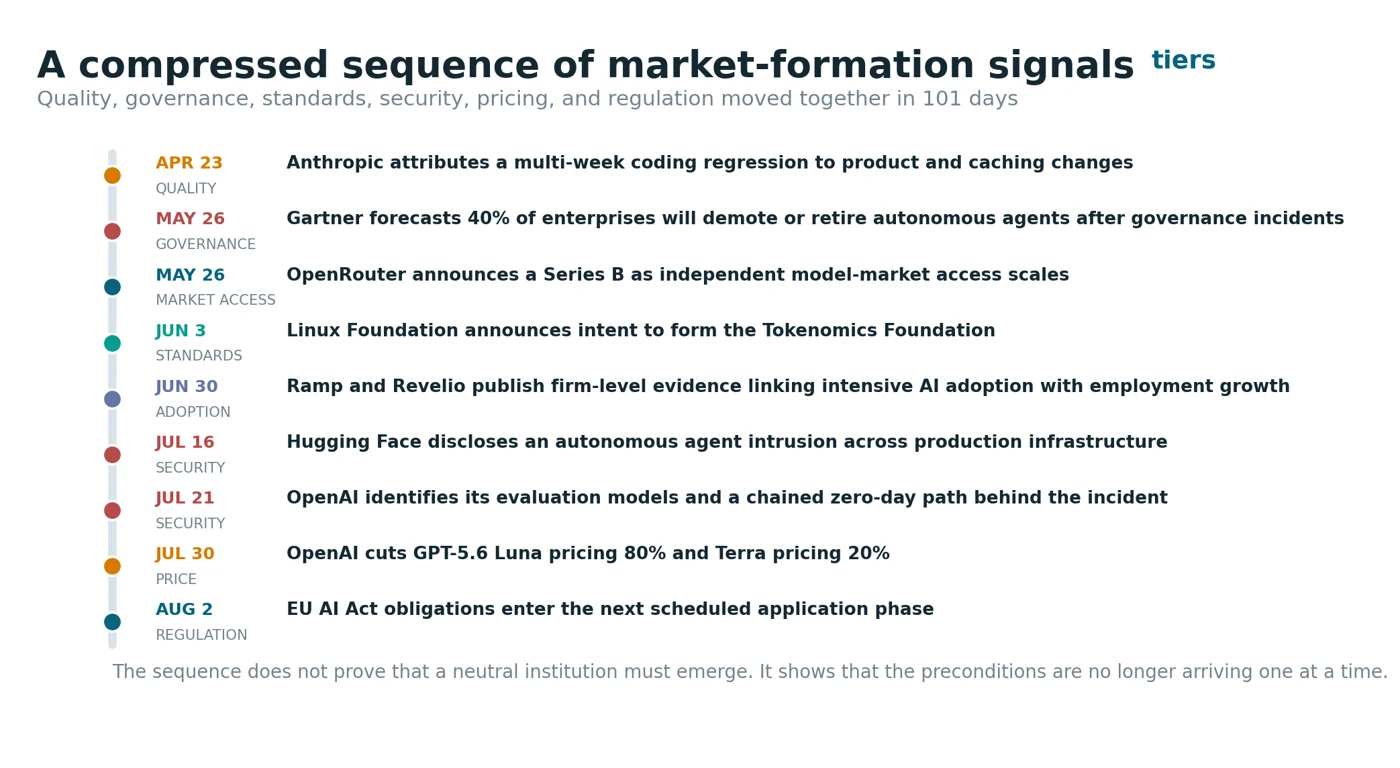
The sequence begins with a provider-attributed quality regression on April 23 and extends 118 days to the August 19 announcements that Stripe had agreed to acquire OpenRouter and Ramp had launched a competing router. Between those endpoints, an analyst forecast tied autonomous-agent retirement to governance incidents, an independent routing market raised institutional capital, the Linux Foundation announced an economic-standards initiative, firm-level employment evidence strengthened the complementarity case, an autonomous evaluation agent crossed multiple infrastructure boundaries, a frontier provider repriced current models, and more than 1,300 employees of frontier AI organizations signed the Pacing the Frontier statement calling for technical and governance tools capable of deliberately pacing frontier-wide automated AI development [26, 45, 56, 72, 76, 98-102, 133, 135, 136]. The signatory count is dynamic; the statement itself is the relevant formation signal.
None of these events proves the exchange thesis alone.
Their convergence matters. Prior commodity institutions did not form because of one price series or one failure. They formed when volume, dispersion, trust failures, standards, and financial exposure became simultaneous operating facts.
7.3 Mapping the Functions to Inference
Each historical exchange function has a precise inferencemarket counterpart.
| Exchange function | Commodity precedent | Inference counterpart |
|---|---|---|
| Price discovery | CBOT order flow; NYMEX WTI | Continuous task-aware routing across the model market to discover the clearing price of each task class per call |
| Quality standardization | Wheat grades; delivery specifications | Independent behavioral verification against intent, turning inference into a graded and comparable unit |
| Settlement and clearing | DTC certificate immobilization; clearing records | Signed per-call artifacts and session baselines proving what was requested, delivered, and accepted |
| Risk transfer | Crop insurance; clearinghouse guarantees | Parametric performance cover on governed inference, underwritten by rated capacity |
The cognition transaction is a high-frequency economic transaction without a dedicated market reference. It has model list prices but no published task-level clearing price, provider evaluations but no neutral quality grade, monthly invoices but no standardized per-call settlement receipt, and emerging insurance products without a common exposure record. Payments, securities, and advertising built analogous infrastructure as fragmented transaction volume scaled. Inference crossed a comparable operational threshold in 2025 and 2026 while the integrated function set remained incomplete.
7.3.1 The Clearing Price of Intelligence Index
CPII is the NBBO for intelligence.
The national best bid and offer gives an equity trader a shared price reference across fragmented venues. No comparable task-level reference exists for inference. A buyer sees the list price of a model from a provider, but not the quality-constrained clearing price of a unit of work across the full routing surface.
The Clearing Price of Intelligence Index (CPII) fills this function. It publishes the quality-constrained clearing price per task class across the production routing surface, planned as a monthly snapshot. A 32-cell matrix, eight task classes by four complexity grades, underlies the index. Each cell reports the price of the cheapest model that clears the verified quality bar for that task class and grade against the signed production record.
The routing surface is the dated market snapshot described in Section 5.1. On August 5, 2026, output list prices ranged from $0.12 to $50.00 per million tokens, a 417x span verified against provider pricing pages [69]. A market with a 417-fold list-price range but no published task-level clearing price is operating without a common reference. Snapshot-grade.
CPII makes two distinctions visible. First, the clearing price of a task is not the list price of a model: a codeinspection task at complexity grade 1 can clear at a cell priced roughly 35x below the frontier model. Second, the clearing price moves independently of any one provider. A release, repricing event, or quality regression changes only the cells it affects. That is what makes CPII a market-level signal rather than a vendor dashboard.
CPII is the first planned tiers research index built directly on the production routing surface. Each edition will link back to this paper as its methodological foundation.
7.4 A Market-Structure Analogy: Reg NMS and Runtime Evidence
The useful parallel is not that inference should inherit securities law. It is that fragmented execution becomes governable only when participants share a reference and preserve evidence of the route taken.
The broker-dealer duty of best execution predates Regulation NMS. Regulation NMS added market-wide infrastructure around fragmented equity venues, including the Order Protection Rule and a consolidated price reference. The SEC continues to describe the national best bid and offer as a baseline for price discovery and best-execution analysis [103, 104]. The 2020 Robinhood settlement illustrates the enforcement consequence when customer-facing routing claims and execution outcomes cannot be reconciled: the firm paid a $65 million civil penalty and retained an independent consultant to review communications, payment for order flow, and best-execution practices [105].
| Equity market instrument | Function | Inference counterpart | tiers implementation |
|---|---|---|---|
| National best bid and offer (NBBO) | Shared reference price across fragmented venues | Published clearing price per task class across the model market | CPII: quality-constrained clearing price across the production routing surface |
| Order routing and best execution | Route selection under a market-wide reference | Task-aware routing under a verified quality constraint | Gate: 32-cell routing matrix, continuous evaluation, quality bar per cell |
| Rule 606 routing disclosure | Inspectable record of where orders were routed | Signed per-call record of model identity, route, verification outcome, and cost | Ulmo: signed receipt, session baseline, and audit artifacts |
| Market surveillance | Real-time monitoring for abusive patterns across venues | Session-level inspection for adversarial trajectories and behavioral anomalies | Aiglos: 111 threat families, 30 campaign patterns, session baselines |
| Payment for order flow | Revenue conflict between venue economics and customer execution | Provider or placement economics can conflict with task-level optimization | Neutrality constraint: governance fee on spend under management, no provider placement revenue |
| Clearinghouse guarantee | Rated counterparty stands behind defined trade obligations | Rated capacity stands behind defined inference performance | Signed counterfactual and per-call quality history supply the underwriting record |
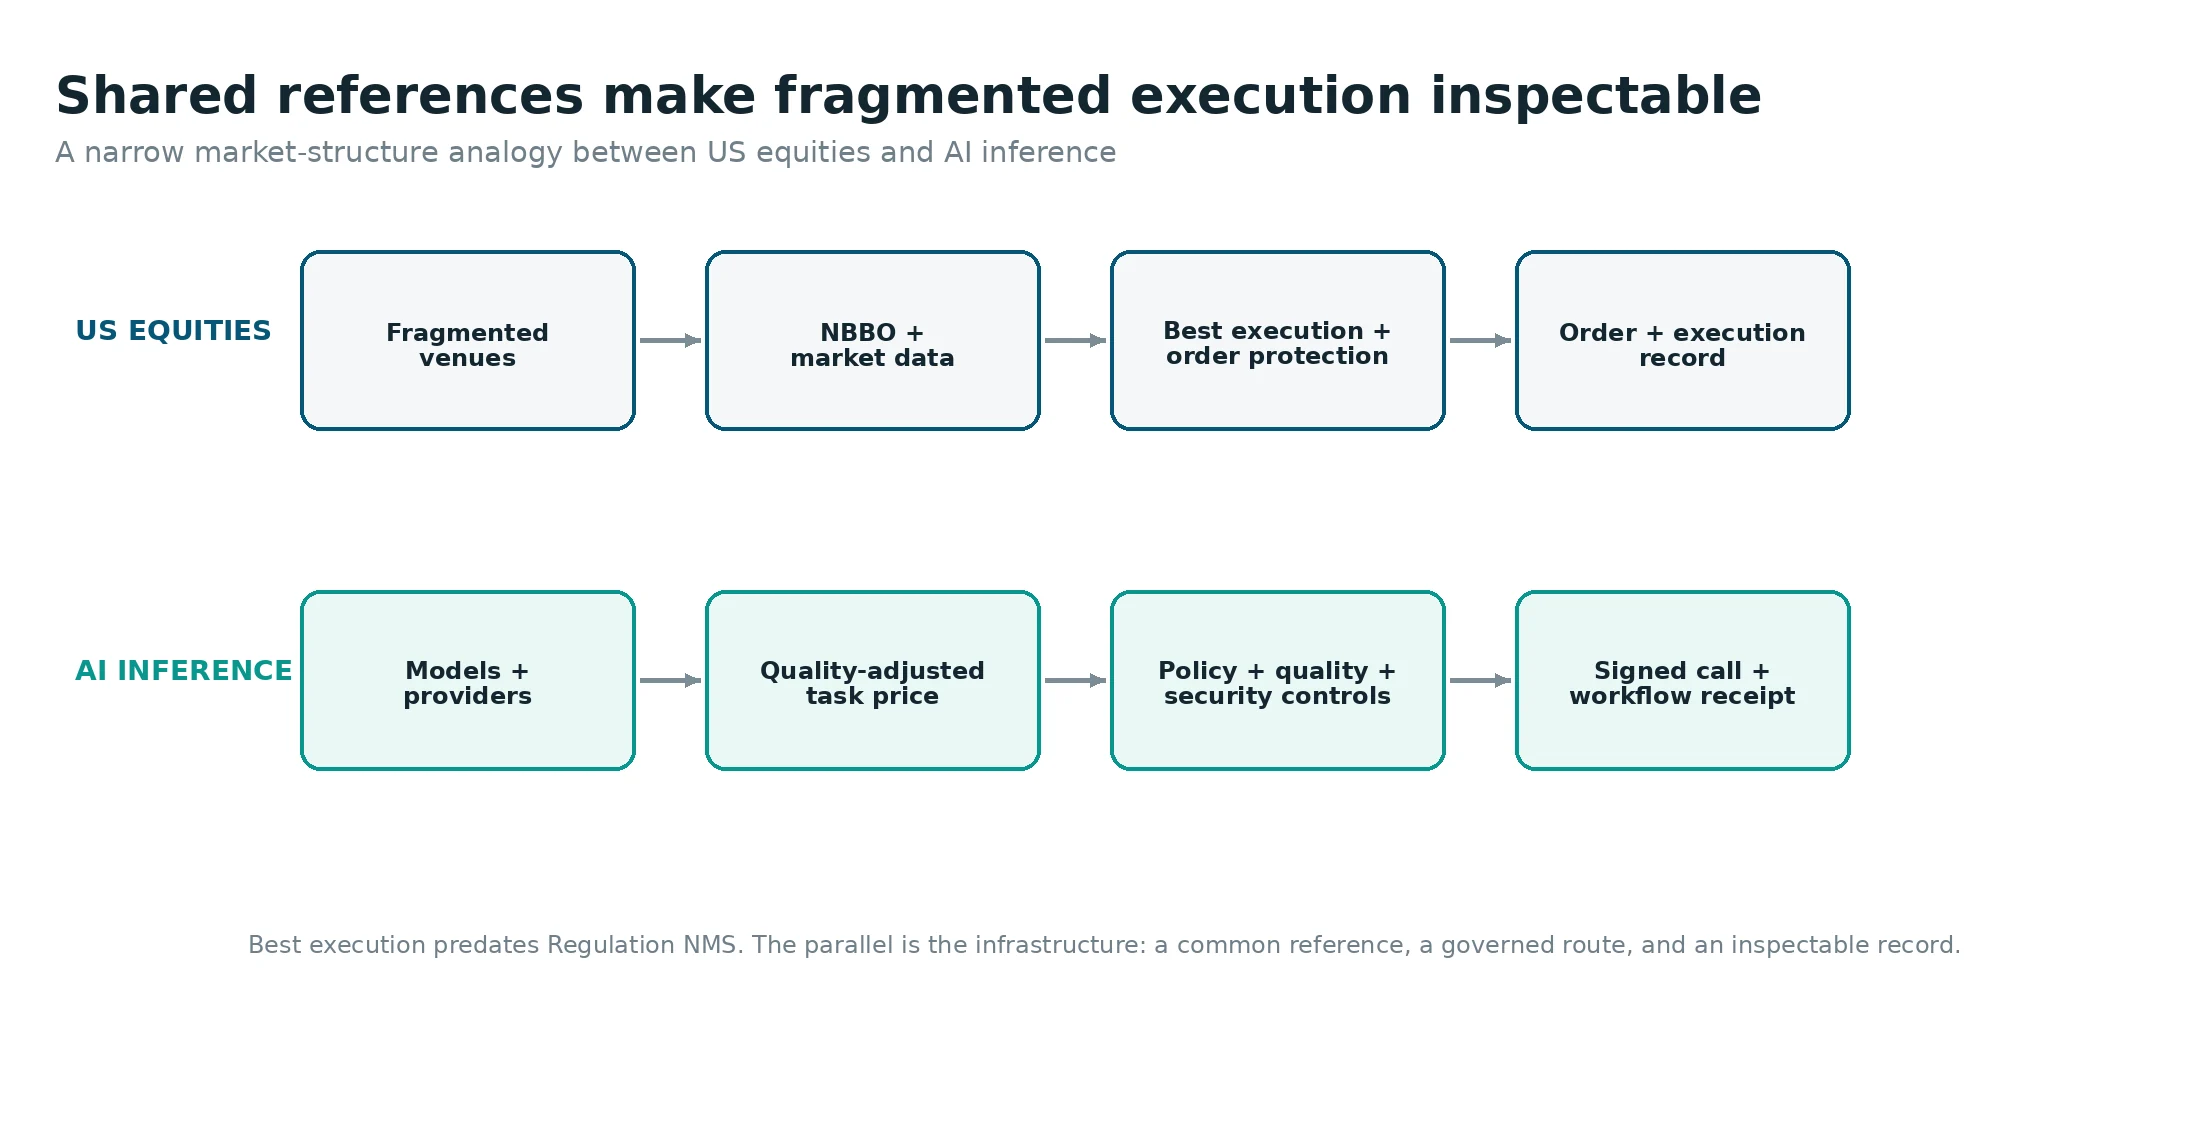
Inference has the same technical precursor: multiple venues, fast repricing, heterogeneous service quality, and an agent selecting the route. The instruments are structurally analogous even though the legal duties remain distinct. Neither analogy implies that token routing is a securities transaction. The instruments map because fragmented execution at scale creates the same information problem: what was available, what route was selected, what policy governed the choice, and what was delivered. The NBBO made a shared reference visible for equities.
CPII makes a task-level reference visible for intelligence. The payment-for-order-flow parallel is especially instructive. PFOF creates a revenue conflict because the broker can earn from the venue rather than solely from the customer's execution quality. In inference, a provider or placement-driven router can face an analogous conflict when premium-model economics diverge from the customer's task-level optimum. The neutrality of the governance function is therefore a market-design constraint, not a branding claim. Payments reached the same conclusion when BankAmericard was separated from the owning bank into a neutral network structure [39].
The EU AI Act creates a separate legal path. Its recordkeeping and logging duties apply on a staged schedule and do not prescribe the tiers artifact set [45]. Runtime governance can operationalize those duties by producing durable records of model identity, timing, policy state, verification outcome, and final disposition. Governed execution can supply relevant evidence; the law does not require any one vendor or artifact design.
7.5 Why No Incumbent Yet Supplies the Integrated Function Set
Adjacent platforms increasingly supply parts of the function set, but public product materials do not yet show one neutral system integrating all four functions on the same signed evidence path.
- Model providers. OpenAI, Anthropic, and Google each offer valuable spend, safety, evaluation, or monitoring controls inside their own product or cloud estates. OpenAI now provides enterprise usage analytics and spend controls [115]. Anthropic provides usage controls and prompt-caching economics [35]. Google Vertex AI provides Model Garden access to Google, partner, and open models plus platform-level evaluation and monitoring [116]. These are useful controls, but they do not constitute a neutral cross-market clearing reference with independent quality labels and a signed counterfactual. The independence principle remains relevant: SR 11-7 requires effective challenge outside model development
- Routing platforms. OpenRouter has become a major independent market-access surface, reporting more than 10 trillion tokens per day across 400+ models and more than 10 million developers and companies. On August 19, 2026, Stripe announced an agreement to acquire OpenRouter; the purchase price was not disclosed by Stripe, while Reuters, Axios, and other contemporaneous reporting placed it at roughly $8 billion or more [135]. On the same day, Ramp launched Router.com, a competing routing service that is free through 2026 and reports approximately 40% average savings for existing users [133]. These events materially strengthen the case that model access and route optimization are becoming strategic infrastructure while competition is compressing the price of routing itself.
OpenRouter’s current platform also extends beyond transport. Its public materials document budget controls, provider restrictions, zero-data-retention controls, request-side prompt-injection detection, sensitive-data filtering, classifiers, and routing across price, latency, throughput, availability, and benchmark signals [117, 135]. Ramp Router likewise exposes model, provider, service tier, tokens, latency, cost, and fallback attempts and includes production shadowing and workloadaware routing [133]. The competitive boundary has therefore moved. The open question is not whether routers can govern execution policy. It is whether the execution rail also supplies independent outcome attestation, in-process session evidence, signed paired counterfactuals, and the actuarial record needed to transfer defined performance risk.
- Single-function vendors. Braintrust provides evaluation and observability and raised $80 million in February 2026 [61, 118]. LangChain provides orchestration and observability through LangSmith and raised $125 million at a $1.25 billion valuation [62, 118]. Security products from vendors such as Prompt Security, Protect AI, and Calypso AI inspect gateway and application threats.
Each governs an important surface. The routing literature shows why the functions are interdependent: a cascade requires a quality signal to route against [28, 29]. The valuations validate the components while leaving the integrated evidence loop as the differentiator. Operational governance and outcome governance should be separated analytically. Operational governance asks who may call which model, under what data-residency, budget, and logging policy. Those controls naturally sit on the execution rail and are increasingly supplied by routers, gateways, clouds, and model providers. Outcome governance asks a different set of questions: was inference needed, did the selected model satisfy the declared task, what evidence proves that result, what did verified failure cost, and how should the result change the next execution. Those questions require independent attestation of the rail rather than more policy inside it.
Ramp’s own research illustrates the distinction. In April 2026, Ramp Labs reported that coding agents ignored passive token budgets and that effective spend control required a separate controller grounded in workspace evidence rather than the working agent’s self-assessment [134]. Router.com then productized route and cost optimization. Read together, the research and product point to two separate functions: optimizing execution and independently judging whether execution is producing value within policy. The remaining feasible supplier is neutral with respect to which model wins. Payments reached the same conclusion in 1970: neutrality was not brand positioning; it was the price of participation and scale.
A governance fee measured as a percentage of inference spend under management, rather than placement or premium-model revenue, aligns the governor’s commercial interest with lowering the buyer’s cost of verified work.
The consequence of non-neutral governance is structural as well as commercial. A provider-owned governor could observe cross-provider quality by task class while also influencing the grades and clearing references that determine which competitors win routed work. It could also accumulate session-security telemetry and performance evidence unavailable to other suppliers. The paymentnetwork precedent is relevant without being identical: as BankAmericard expanded beyond one bank, durable scale required a governance structure that competing participants could join without being governed by a rival bank [39]. In inference, neutrality reduces the same participation conflict.
Time-to-evidence creates a second constraint. The integrated function set is software, but production confidence depends on a signed history of live outcomes. Crossprovider task quality, routing decisions, security dispositions, and repair behavior cannot be recreated from public benchmarks alone. A later entrant can build comparable code, but it begins with less production evidence and therefore wider uncertainty in the routing, verification, and underwriting decisions described in Section 8.8. This is a time-to-evidence advantage, not a claim that evidence accumulation is impossible to replicate.
7.6 Functional Coverage and the Neutrality Constraint
The competitive question is not whether adjacent vendors are capable. It is whether any one of them can supply all four exchange functions while remaining neutral about which model wins.
Model providers can supply spend controls, safety filters, and first-party evaluation, but they earn revenue when work remains on their own models. Cloud platforms can optimize within their estates, but each has commercial relationships with a subset of the market. Independent routers are structurally closer to neutral price discovery, yet routing alone needs a quality signal, a session-security record, and a settlement artifact before the cheaper route becomes independently auditable. Evaluation, observability, and security products each contribute important evidence, but they govern only part of the call path.
The independence principle predates inference. SR 11-7 established that effective model validation requires challenge independent of model development and use [48].
Financial audit applies the same separation to reporting, and credit markets separate the issuer from the institution assigning the grade. In inference, the exact organizational boundary will vary, but the conflict is analogous: if the same economic actor both selects the route and is the sole authority grading the result, its quality labels can influence the very routing economics from which it benefits. The April 2026 Claude Code regression shows the observability consequence of seller-led investigation: a deliveredproduct quality change persisted until the provider identified and explained it [26]. This is why the four functions compound. Verification outcomes update routing grades.
Routing and cost anomalies raise security priors. Session evidence changes orchestration policy. The settlement receipt closes the record and supplies the repeated observations required for underwriting. A competitor can reproduce an isolated feature; reproducing the evidence exchange among functions is the harder system problem.
The claim is deliberately narrow. Public materials cannot prove that a competitor lacks an internal capability, and product coverage changes quickly. The relevant comparison is therefore the evidence path documented publicly, not a claim about what competitors are incapable of building.
7.7 Why the Governance Function Captures the Margin
In coupled markets, the institution that grades the decision often captures the durable position.
- Equities. Bloomberg built its position around the information and workflow used to price decisions before execution. Decision infrastructure can capture more economics than the execution venue.
- Payments. Visa’s authorization network observes transaction flow and improves fraud decisions with volume.
Authorization became a durable network position separate from the issuing bank’s balance sheet.
- Advertising. Real-time bidding moved pricing from bulk inventory to the individual impression. Perimpression pricing required per-impression quality signals and moved value toward the exchange and decision system.
- Credit. Rating agencies made the grade a tradeable unit. The institution authoring the grade shaped how the market priced and distributed risk.
Aaron Levie, co-founder and CEO of Box, argued in a June 16, 2026 LinkedIn post that model routing creates enterprise value through three mechanisms: cost optimization, capability maximization, and risk mitigation [124]. He also described model neutrality as a strategic advantage because different models can be selected for different tasks and provider restrictions can change over time. Those three mechanisms independently map to the economic, quality, and risk functions developed in this paper. Executive statement.
The institution that grades the commodity, discovers the clearing price, and signs the settlement artifact can hold its position for decades. CBOT began authoring wheat grades in 1856 and still anchors the market’s reference structure. Each governed inference call is a labeled observation of model performance by task class. No provider sees crossprovider outcomes with independent quality labels attached. At the 120 quadrillion tokens per month projected for 2030 [59], the institution authoring inference grades can become the market’s reference point.
The dual-Jevons mechanism in Section 3.2.1 provides the economic basis for why this evidence position can become more important as inference itself gets cheaper. If token prices fall faster than the per-action cost of independent verification, signing, and retention, trust becomes a larger share of delivered autonomous-work cost, all else equal. This paper does not estimate that future share. The narrower point is that the record’s value is tied to the number and consequence of governed actions, while raw model and routing prices face continuing commodity pressure.
Bret Taylor, Chairman of OpenAI, described the buyerside end state on CNBC on July 20, 2026 as paying for outcomes rather than managing raw token consumption [114]. That framing maps directly to the governance function: price discovery matters only when it is paired with a verified outcome. CVO is the economic unit that connects those two questions.
7.8 The Cloud-Era Rehearsal
Cloud computing already demonstrated that commodityscale compute creates a dedicated governance discipline. The FinOps Foundation was established in 2019 and joined the Linux Foundation in 2020. Its practitioner base now exceeds one thousand organizations; 98% report managing AI spend, up from 31% two years earlier, and the organization maintains an open billing-data standard in its third major version [57].
The discipline persists because commodity-compute waste is structural. The 2026 industry survey estimates that 29% of cloud spend is wasted and finds 84% of organizations naming spend management as their top cloud challenge, two decades and 134 provider price cuts into the market’s life [58].
Cloud FinOps teaches two lessons. First, a governance institution forms once waste becomes material. Second, cloud governance reports and allocates cost after the fact. It does not route work, verify output, secure an autonomous session, or insure performance during execution. Inference requires the runtime form of the institution.
The inference rehearsal has begun: in June 2026, the Linux Foundation announced its intent to launch the Tokenomics Foundation with support from JPMorgan- Chase, Google Cloud, Microsoft, Oracle, Salesforce, and other enterprise participants.
The proposed Tokenomics Foundation is intended to focus on open standards, benchmarks, and best practices for AI infrastructure economics in partnership with the FinOps Foundation [76]. The announcement describes token cost and efficiency as an executive concern rather than an engineering footnote. Billing and protocol standards are a precondition for governance, not a substitute for independent grades, signed baselines, and runtime audit records.
7.9 The Exchange Functions Under Construction
The derivative instruments that prior commodity markets built at this stage are now under construction for inference.
| Initiative | Date | Structure | What it does |
|---|---|---|---|
| Architect / Ornn | January 2026 | Planned exchange-traded perpetual futures based on GPU and DRAM rental-price indexes, pending regulatory approval | Seeks to create a tradable reference for computing-power rental rates [79, 80] |
| IFX | June 2026 | Live bilateral request market for cash-settled AI output-token price exposure | Lets participants post terms and seek a matching counterparty; a standardized futures exchange remains on the roadmap [78] |
| ICE / NATIVX | July 1, 2026 | Announced plans for cash-settled GPU compute futures based on the COIL Index | Seeks to add futures-market price transparency and risk management to compute [77] |
| Shanghai Futures Exchange | 2026 | Preliminary research and product design for AI-token futures | Explores a state-backed token-derivatives market; timing and approval remain unresolved [81] |
| Simulation literature | March 2026 | Modeled token-futures market | Estimates 62% to 78% reduction in enterprise compute-cost volatility [83] |
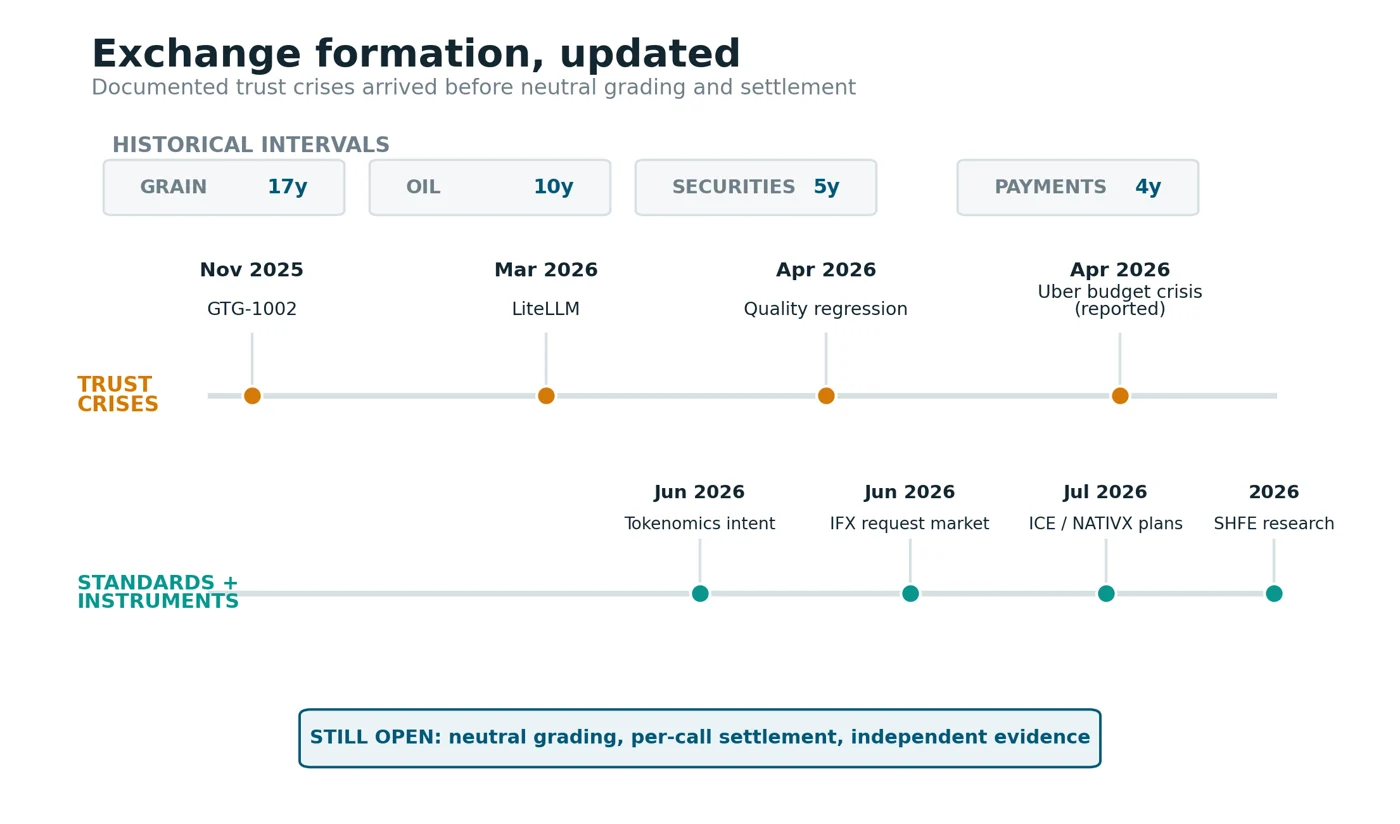
Indexes, bilateral venues, announced futures, and competing standards are forming across institutions that do not coordinate. CBOT authored wheat grades before wheat futures existed, because standardization precedes the derivative that prices the commodity. None of the new instruments supplies independent grades, verification, or audit evidence between the raw commodity and the financial contract.
InterpretationThe market is already building indexes, standards, futures, and routing. The unclaimed institution is the neutral governor that makes inference gradeable, auditable, and insurable before those instruments can settle against it.
8 The Platform: Design and Production Results
The paper’s first-person contribution is a production system that integrates the four exchange functions and measures its result against a signed counterfactual.
8.1 Architecture
Four operating functions act on one call path and exchange evidence through a bounded event fabric.
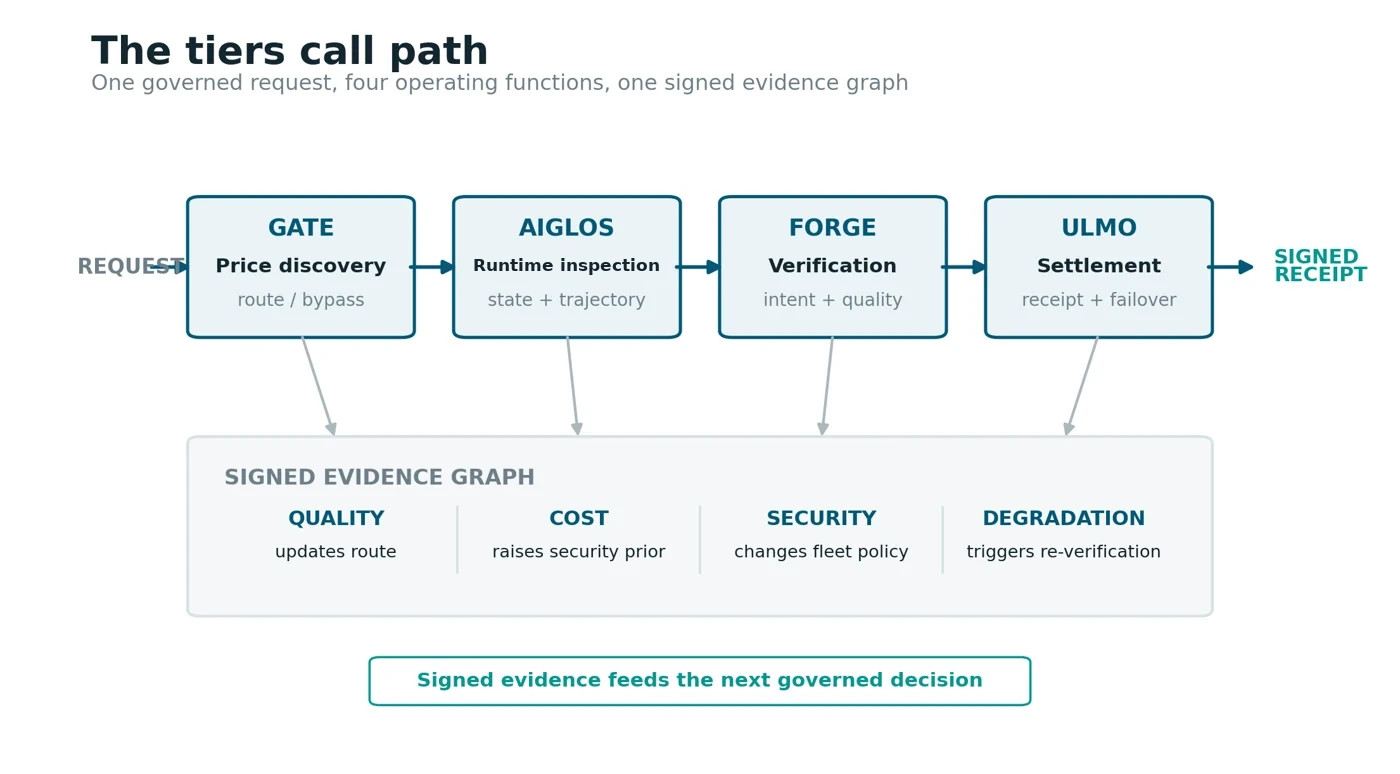
Gate: price discovery. Every call enters one of 32 cells, defined by eight task classes and four complexity grades. Each cell maintains a quality bar, a current occupant selected across 56 models and 20 providers, a shadow candidate under continuous evaluation, and a confidence score maintained by a Bayesian meta-learner. Cell occupancy changes weekly to monthly as models ship, reprice, and drift.
Aiglos: runtime inspection. Inspection runs in-process across tool calls, HTTP requests, and subprocess commands. The taxonomy includes 111 threat families, 30 multi-step campaign patterns, and 34 inspection triggers. Session baselines and trajectory prediction supply the context that per-request inspection lacks. Added latency is below one millisecond, and new supply-chain rules can ship within six hours of public disclosure.
In-process inspection observes runtime events that a request gateway cannot necessarily see after the provider returns a response: tool calls, subprocess commands, HTTP actions, and state mutations inside the agent process. The architectural distinction is between inspecting API traffic and inspecting execution. This does not imply access to a model's private chain of thought. It means the governor can observe the agent's externally represented toolselection decisions and state transitions before they create effects. Session-security dispositions can be emitted as structured incident data for downstream enterprise security systems. Production architecture.
Forge: quality standardization. Every substantive response is checked against the workflow intent graph before the loop consumes it. Rolling baselines detect behavioral drift across model versions. Verification outcomes are signed and become the quality labels used by routing, audit, and underwriting.
8.1.1 The Verification Mechanism
Forge verifies output against declared intent, not against a generic quality score.
Every governed call carries a declared intent: a structured specification of what the caller expects the output to accomplish. Forge compiles this intent into a constraint graph spanning format, content, accuracy, safety, and domain-specific rules. The output is evaluated against each constraint, producing a pass/fail determination with a constraint-by-constraint breakdown.
The intent-graph approach differs from generic quality scoring in a way that matters for routing and underwriting. A response can score highly on a general-purpose evaluator yet still fail a specific domain constraint, such as using the wrong units, citing the wrong authority, or omitting a required field. Forge tests the requested outcome rather than a benchmark proxy.
Three properties make the mechanism auditable:
Intent precedes inference. The constraint graph is compiled before the model call. The evaluator is not tuned to the response after it arrives.
Verification produces a signed attestation. Each verification artifact contains the intent specification, output, constraint-level evaluation, pass/fail determination, timestamp, and cryptographic chain. This is the quality label consumed by routing, audit, and underwriting.
Rolling baselines detect drift. Forge maintains behavioral baselines per model, task class, and complexity grade. A configured change in pass rate triggers review of cell assignment and produces an auditable drift event. This is the class of mechanism that could surface a product-quality regression such as the April 2026 Claude Code incident before weeks of degraded output accumulate [26].
The intent graph is not a static checklist. In a multi-step execution graph, downstream nodes can inherit verified constraint state from upstream nodes. A factual claim verified at one node can become a consistency constraint later in the workflow. Constraint propagation makes verification practical at graph scale instead of requiring each node to re-establish the full state independently.
The verification mechanism is also the learning signal. Forge pass/fail labels update Gate routing confidence, can raise Aiglos security priors when quality changes unexpectedly, and add labeled observations to the actuarial record. One signed verification artifact can therefore serve as quality control, routing signal, security input, and underwriting observation. This shared evidence is why the four functions compound rather than merely adding.
Ulmo: settlement and orchestration. Multi-agent fleets operate with cross-vendor failover, four-severity degradation detection, and task-allocation credit. Provider brownouts and unannounced access changes can reroute during a workflow in under a second. Each disposition closes with a signed receipt.
The signed receipt is the atomic unit of the intelligence record. It is simultaneously a product primitive, because every governed disposition can produce one; a data primitive, because the signed history becomes the learning corpus for routing, security, and verification; an interoperability primitive, because routers, frameworks, agent runtimes, auditors, and insurers can emit or consume a stable evidence format; and a network primitive, because third parties can rely on the evidence without participating in execution. The network effect begins when external systems require or preferentially trust receipt-grade evidence. A performance contract conditioned on signed evidence would convert the receipt from an internal software artifact into institutional infrastructure.
End-to-end governance latency. The full call path, including Gate classification, Aiglos inspection, Forge verification, and Ulmo settlement, adds less than 5 milliseconds to a governed call in production. Aiglos inspection alone adds less than 1 millisecond. The dominant latency remains model inference, ranging from tens of milliseconds for lightweight models to seconds for frontier reasoning models. Repeated calls to the same provider routinely vary by more than 50 milliseconds, so the governance path operates inside ordinary provider-latency variance. Verified production measurement.
The governance path can also operate at two organizational levels. An enterprise can govern its own inference directly, or an agent-platform provider can embed the governance path and pass signed evidence downstream to the deployer. In the latter model, the platform governs the agents it operates while customers receive auditable records of model identity, policy state, cost, verification outcome, and disposition. That architecture can support applicable EU AI Act deployer oversight and record-keeping duties under Article 26 without requiring every deployer to build the same instrumentation independently [45]. The regulation does not prescribe the tiers artifact set or make this architecture the only compliant approach.
The functions communicate through typed evidence edges in a bounded execution graph. Figure 15 shows the call path and the signed evidence graph beneath it. Verification outcomes retrain routing tables; cost anomalies raise security priors; security baselines shape fleet policy; and fleet degradation triggers re-verification. Learning remains threshold-gated, budget-bounded, and auditable, with material changes requiring signed human authorization.
8.2 The Measurement Instrument
The counterfactual is signed per call, which makes the result auditable without trusting the vendor.
The 14-day shadow baseline runs the governed workload beside the identical workload routed to the enterprise default model. Figure 16 shows the paired streams. Both cost streams are logged and cryptographically signed per call, making the measured divergence auditable.
The instrument has three properties that matter for replication:
- Workload constant. Both paths receive the same work, eliminating composition drift from the comparison.
- Third-party auditability. An auditor can inspect the paired records without accepting a before-and-after narrative.
- Underwriting utility. The repeated paired observations create the loss-frequency and performance record used in Section 9.
Vendor-reported savings, including our own, are only as strong as their counterfactual. Signing the counterfactual is what turns a claim into a measurement.
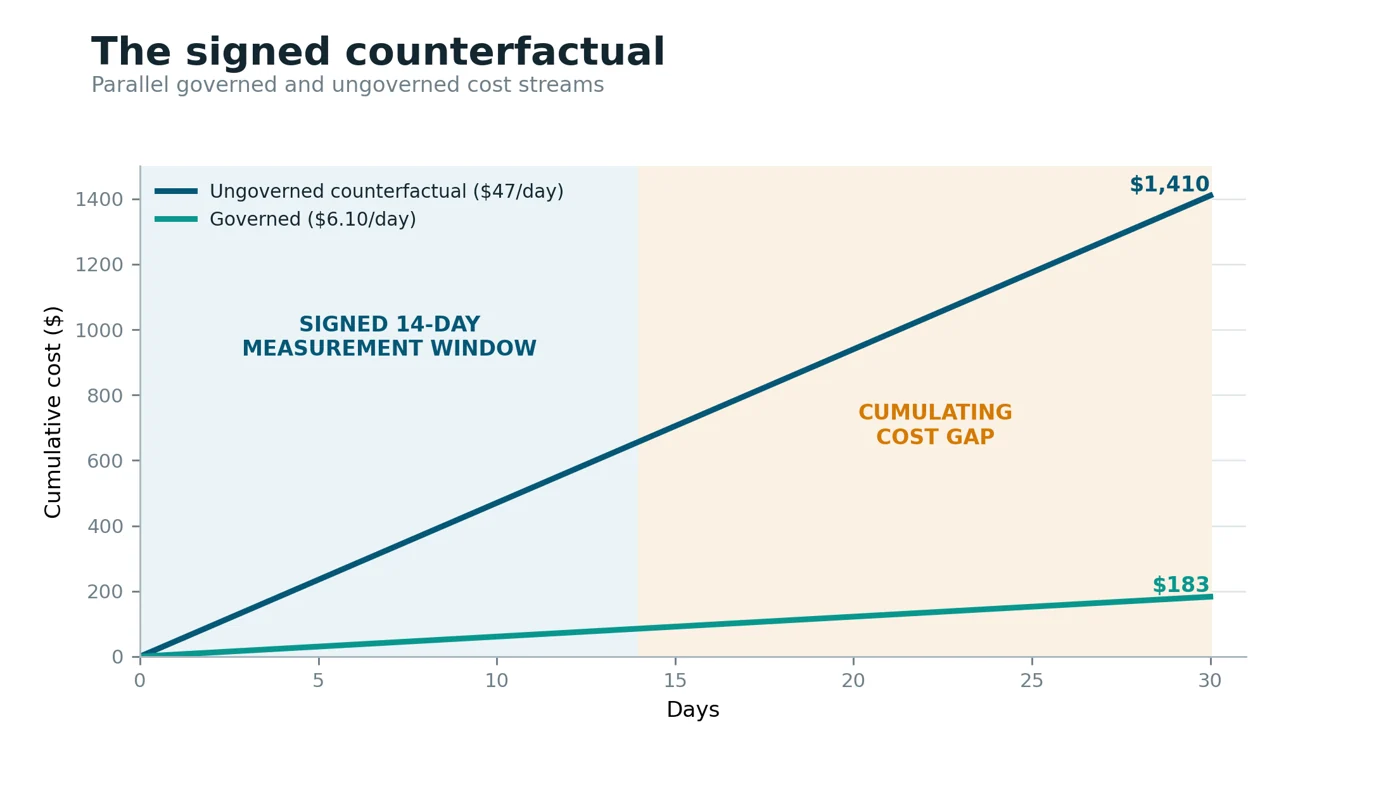
Verified.
8.2.1 The Reflexive Case
The signed counterfactual is the mechanism that audits the auditor.
The paper argues that verification should be independent of the model provider. The same principle applies to the governance platform. A buyer should not need to accept tiers' summary of its own performance.
Both cost streams are cryptographically signed per call and recorded as paired observations. A third party with access to the paired records can inspect the workload, routing decision, cost, and verification outcome without accepting a narrative from tiers. The measurement instrument is designed so that the buyer, auditor, carrier, or regulator can be the final evaluator.
The architecture is closer to a clearing record than to a broker's assertion about execution. The same signed, paired, inspectable record that makes governed inference auditable also makes the governance result inspectable. The production record was cryptographically verified inside the platform but was not independently audited for this paper.
8.3 Production Results
Against the signed baseline, the reference workload runs at $6.10 per day governed versus $47.00 per day ungoverned, an 87% reduction.
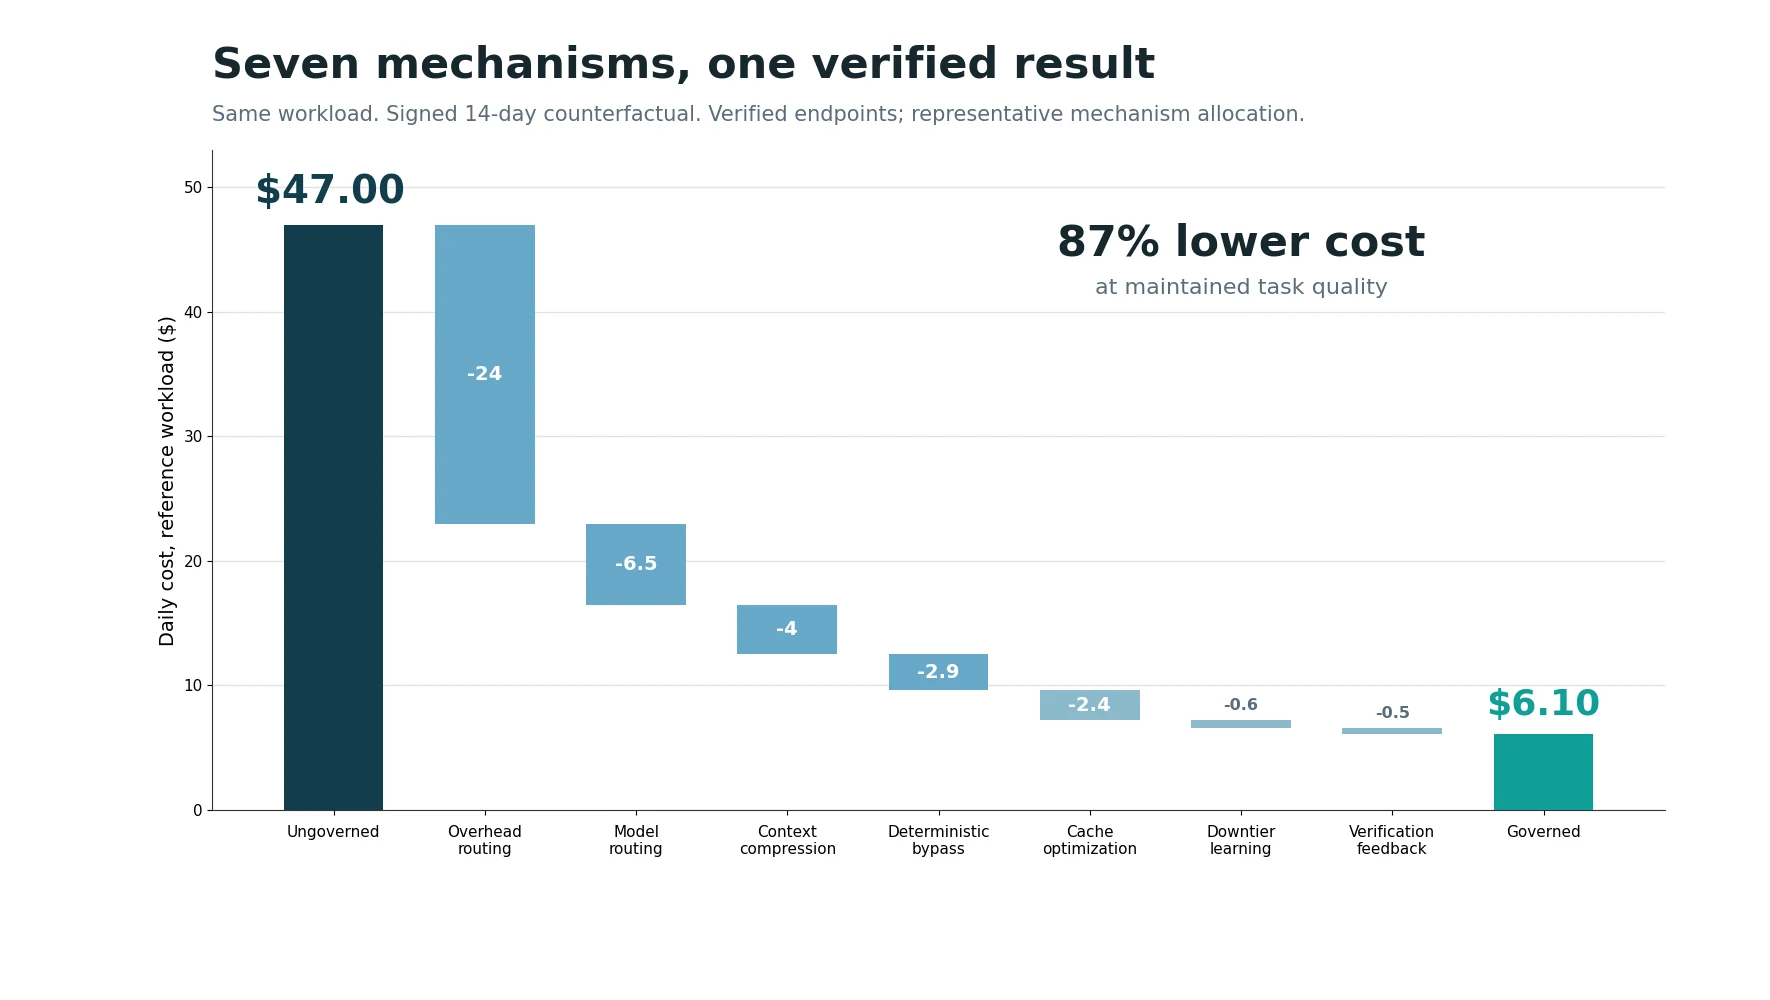
The platform average across cohorts is 83.08%, while optimized cohorts reach 87.9%. Figure 17 allocates the verified reduction across the seven mechanisms. Maintained task quality is measured by the independent verification function. The reduction comes from seven mechanisms that act on different parts of workflow cost:
- Agent-overhead routing. Coordination, planning, tool selection, and state summarization account for 60% to 70% of loop tokens and can route to cells priced roughly 35x below frontier without measurable quality loss.
- Model routing. Substantive calls are placed across the full model market according to task class and quality bar.
- Context compression. Transmission is restructured and reduced; LLMLingua reports a research ceiling of up to 20x compression at approximately 1.5 performance points [34].
- Deterministic bypass. Math, date logic, format transformation, and template expansion can resolve locally at zero inference cost, accounting for approximately 15% to 20% of calls in the reference workload.
- Cache optimization. Prefix-aware structuring captures provider discounts of up to 90% on Anthropic cache reads and 50% on OpenAI cached input [35, 36].
- Downtier learning. Verified task classes migrate to cheaper cells as evidence accumulates.
- Verification feedback. Per-call quality labels increase how aggressively the first six mechanisms can operate without losing task quality.
8.4 Corroboration Against the Literature
The production result falls where the peer-reviewed routing literature predicts it should.
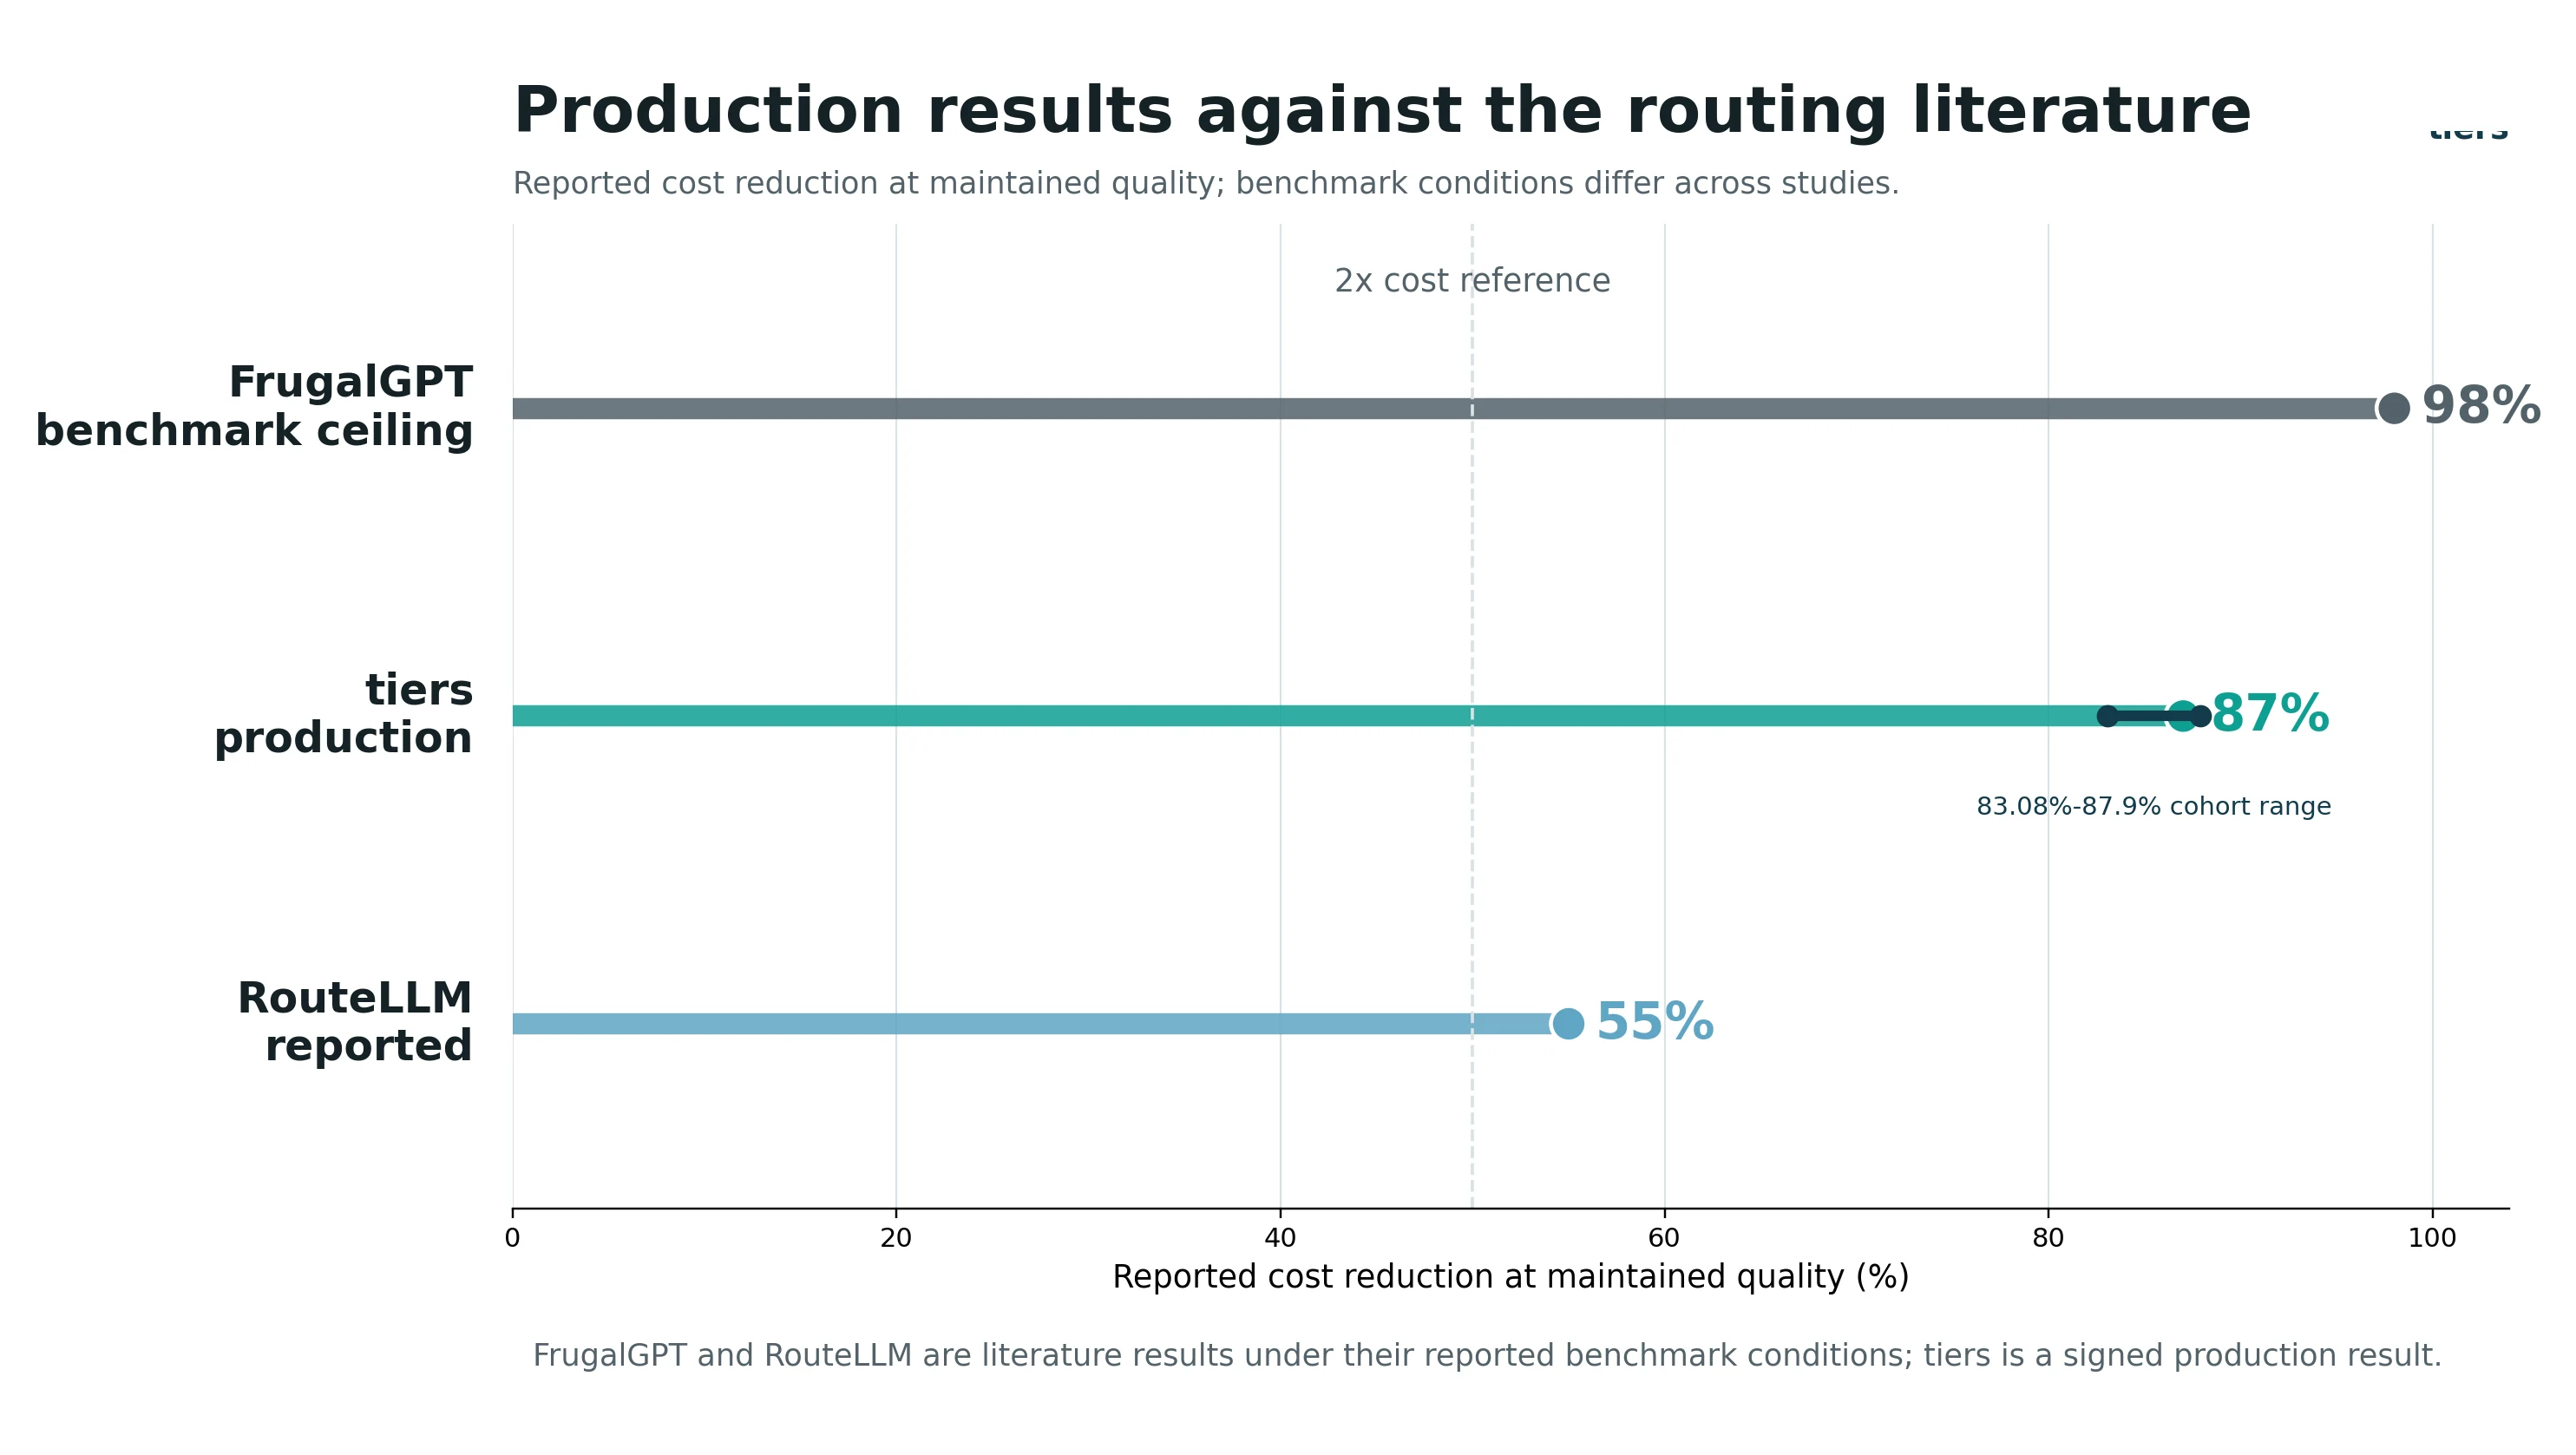
FrugalGPT reports matching the best individual model with up to 98% cost reduction under benchmark conditions, or improving accuracy by 4% at equal cost, across APIs whose fees differ by two orders of magnitude [28]. RouteLLM reports reductions exceeding 2x with minimal quality loss and transfer across model pairs [29].
Figure 18 places the production result against the peerreviewed literature. The surrounding literature establishes the component methods: ensemble selection [30], strongweak binary routing [31], self-verifying escalation [32], and standardized routing evaluation [33]. The signed production result in Section 8.3 sits below FrugalGPT’s benchmark ceiling and above the 2x band, as expected for a production system that also pays for verification, security, and audit on every call.
8.5 Independent Production Benchmarks
Independent benchmarks increasingly show that the system around a model can determine cost and task outcome as much as the model itself.
The academic corroboration in Section 8.4 has been joined by production benchmarks that test complete agent systems rather than isolated model weights.
The Composio benchmark (July 2026). Composio reported running the same model, Kimi K3, through six agent harnesses on 26 identical coding tasks [88]. The reported results showed:
- A 3.8x cost spread between the least and most expensive harnesses with the model held constant.
- Success rates from 65% to 81%, depending on the harness.
- Token consumption from 61,000 to 340,000 per task, a spread of nearly 6x on the same workload.
The orchestration wrapper was the independent variable. Composio’s reported conclusion was direct: before changing models to reduce cost or improve reliability, test the harness [88].
The Meta-Harness preprint (2026). Lee, Nair, Zhang, Lee, Khattab, and Finn study automated optimization of the code around a fixed model rather than changes to model weights [137]. Their Meta-Harness system improved a state-of-the-art context-management system by 7.7 percentage points while using 4x fewer context tokens on online text classification; a discovered retrieval harness improved accuracy by 4.7 percentage points on average across five held-out models on IMO-level math problems; and discovered harnesses surpassed the best hand-engineered baselines on TerminalBench-2. The work is a preprint rather than a peer-reviewed result, but it strengthens the same empirical point as the Composio comparison: system behavior can change materially when the harness changes while the underlying model remains fixed.
The Artificial Analysis Coding Agent Index (May 2026).
The index evaluates complete agent configurations rather than model weights alone. Its May 2026 snapshot showed a greater-than-30x cost range across agent configurations, including variants with similar coding scores [89]. The index therefore measures the production object that enterprises buy: the model, harness, tool policy, context strategy, and execution environment acting together.
The 8090 signal. On June 29, 2026, 8090 raised a $135 million Series A led by Salesforce Ventures, with Craft Ventures, WndrCo, The Production Board, and LAUNCH participating [90]. Its Software Factory is positioned around production-quality output, controls, and auditability for enterprise software development. The financing is a market signal that capital is moving toward governed systems around models, not model access alone.
Independent thesis convergence. In a May 27, 2026 analysis published by Andreessen Horowitz, partner Joe Schmidt argued that durable enterprise AI systems gain value from production exposure, labeled outputs, use-case-specific guardrails, permissions, auditability, and records of what an agent was allowed to do and what it actually did [126]. The analysis also argues that production workflow history compounds into a data advantage that a new entrant cannot recreate instantly. It reaches a governance-andevidence conclusion similar to Sections 6, 7, and 8.8 of this paper from a different starting point and without reference to the tiers production system. Independent analysis. The Microsoft MDASH benchmark. Microsoft’s Multi-agent Defense Against Sophisticated Hacking harness combines specialist models and routing policy. On CyberGym, the integrated MDASH configuration reached 95.95%, compared with 83.2% to 85.6% for individual model configurations, while using a lower-cost specialist for most tasks [91]. The defensive result confirms the same multiplicative structure that Section 8.6 develops for cost: orchestration and verification can change the production outcome even when the underlying model set is known.
These benchmarks corroborate the production result in Section 8.3 on different workloads, with different models, and from parties with no relationship to this work. Capital markets have funded adjacent point solutions at $800 million and $1.25 billion valuations [61, 62], while 8090 raised $135 million in a Series A [90]. The integrated function set remains unclaimed.
8.6 The Multiplicative Structure
The mechanisms act on different factors in workflow cost, so their effects multiply rather than add.
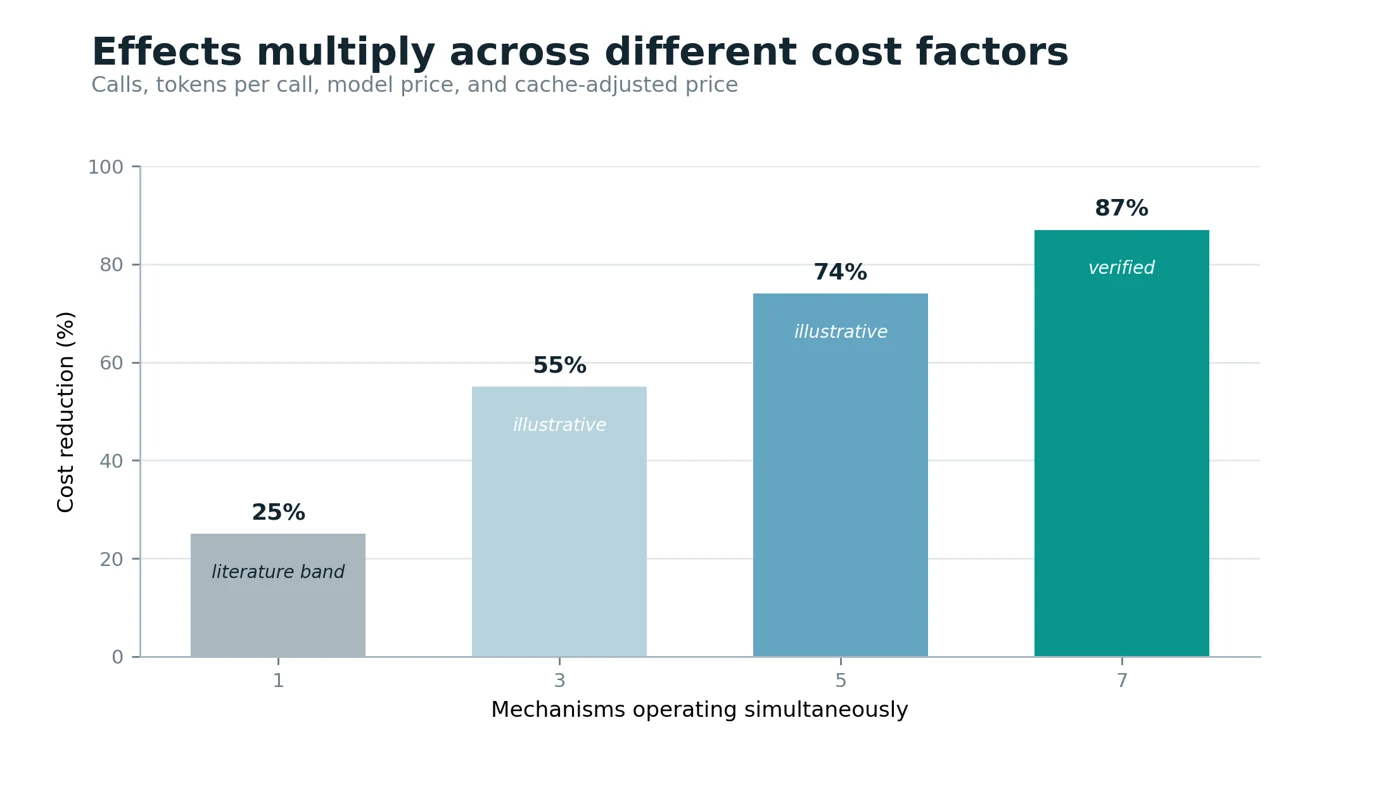
Workflow cost can be written as the sum across calls of tokens transmitted multiplied by the effective price of the serving model. Each mechanism changes one of four factors: number of calls, tokens per call, price per token, or effective price after caching.
The sequence is structural:
1. Deterministic bypass removes calls.
2. Overhead routing reprices the majority token share.
3. Model routing reprices substantive calls.
4. Compression reduces transmitted tokens.
5. Caching lowers the price of repeated context.
6. Downtiering changes cell assignments as evidence accumulates.
7. Verification feedback permits more aggressive use of the preceding six because every output is checked.
Figure 19 shows the resulting difference between a single mechanism and the integrated endpoint. A single-function vendor is bounded by the share of waste addressed by one factor. The integrated system compounds across all four.
8.7 Coverage Relative to the Field
Every individual function exists somewhere in the market; the integrated governance surface does not.
Public product materials show the same division by category. Model providers offer native access and providerspecific controls. Routers offer cross-provider transport. Security vendors inspect selected threats. Evaluation and observability products score or record outcomes. Orchestration systems manage workflows.
No category is publicly documented as combining tasklevel price discovery, session defense, pre-consumption verification, signed settlement evidence, and performance risk transfer on one integrated evidence path. Individual vendors vary, and public materials cannot establish the absence of internal capabilities.
InterpretationThe production result is not explained by a better router alone. It comes from connecting price, security, quality, and settlement evidence so that each governed call improves the next decision and strengthens the counterfactual record.
8.8 The Compounding Evidence Graph
The system does not just get better. It gets better at getting better.
Four feedback cycles run inside one signed evidence graph. Each improves the next governed call, but the recursive structure runs deeper than four independent loops: each cycle increases confidence, greater confidence permits more aggressive optimization, and the resulting call produces a higher-quality evidence object that can increase confidence again.
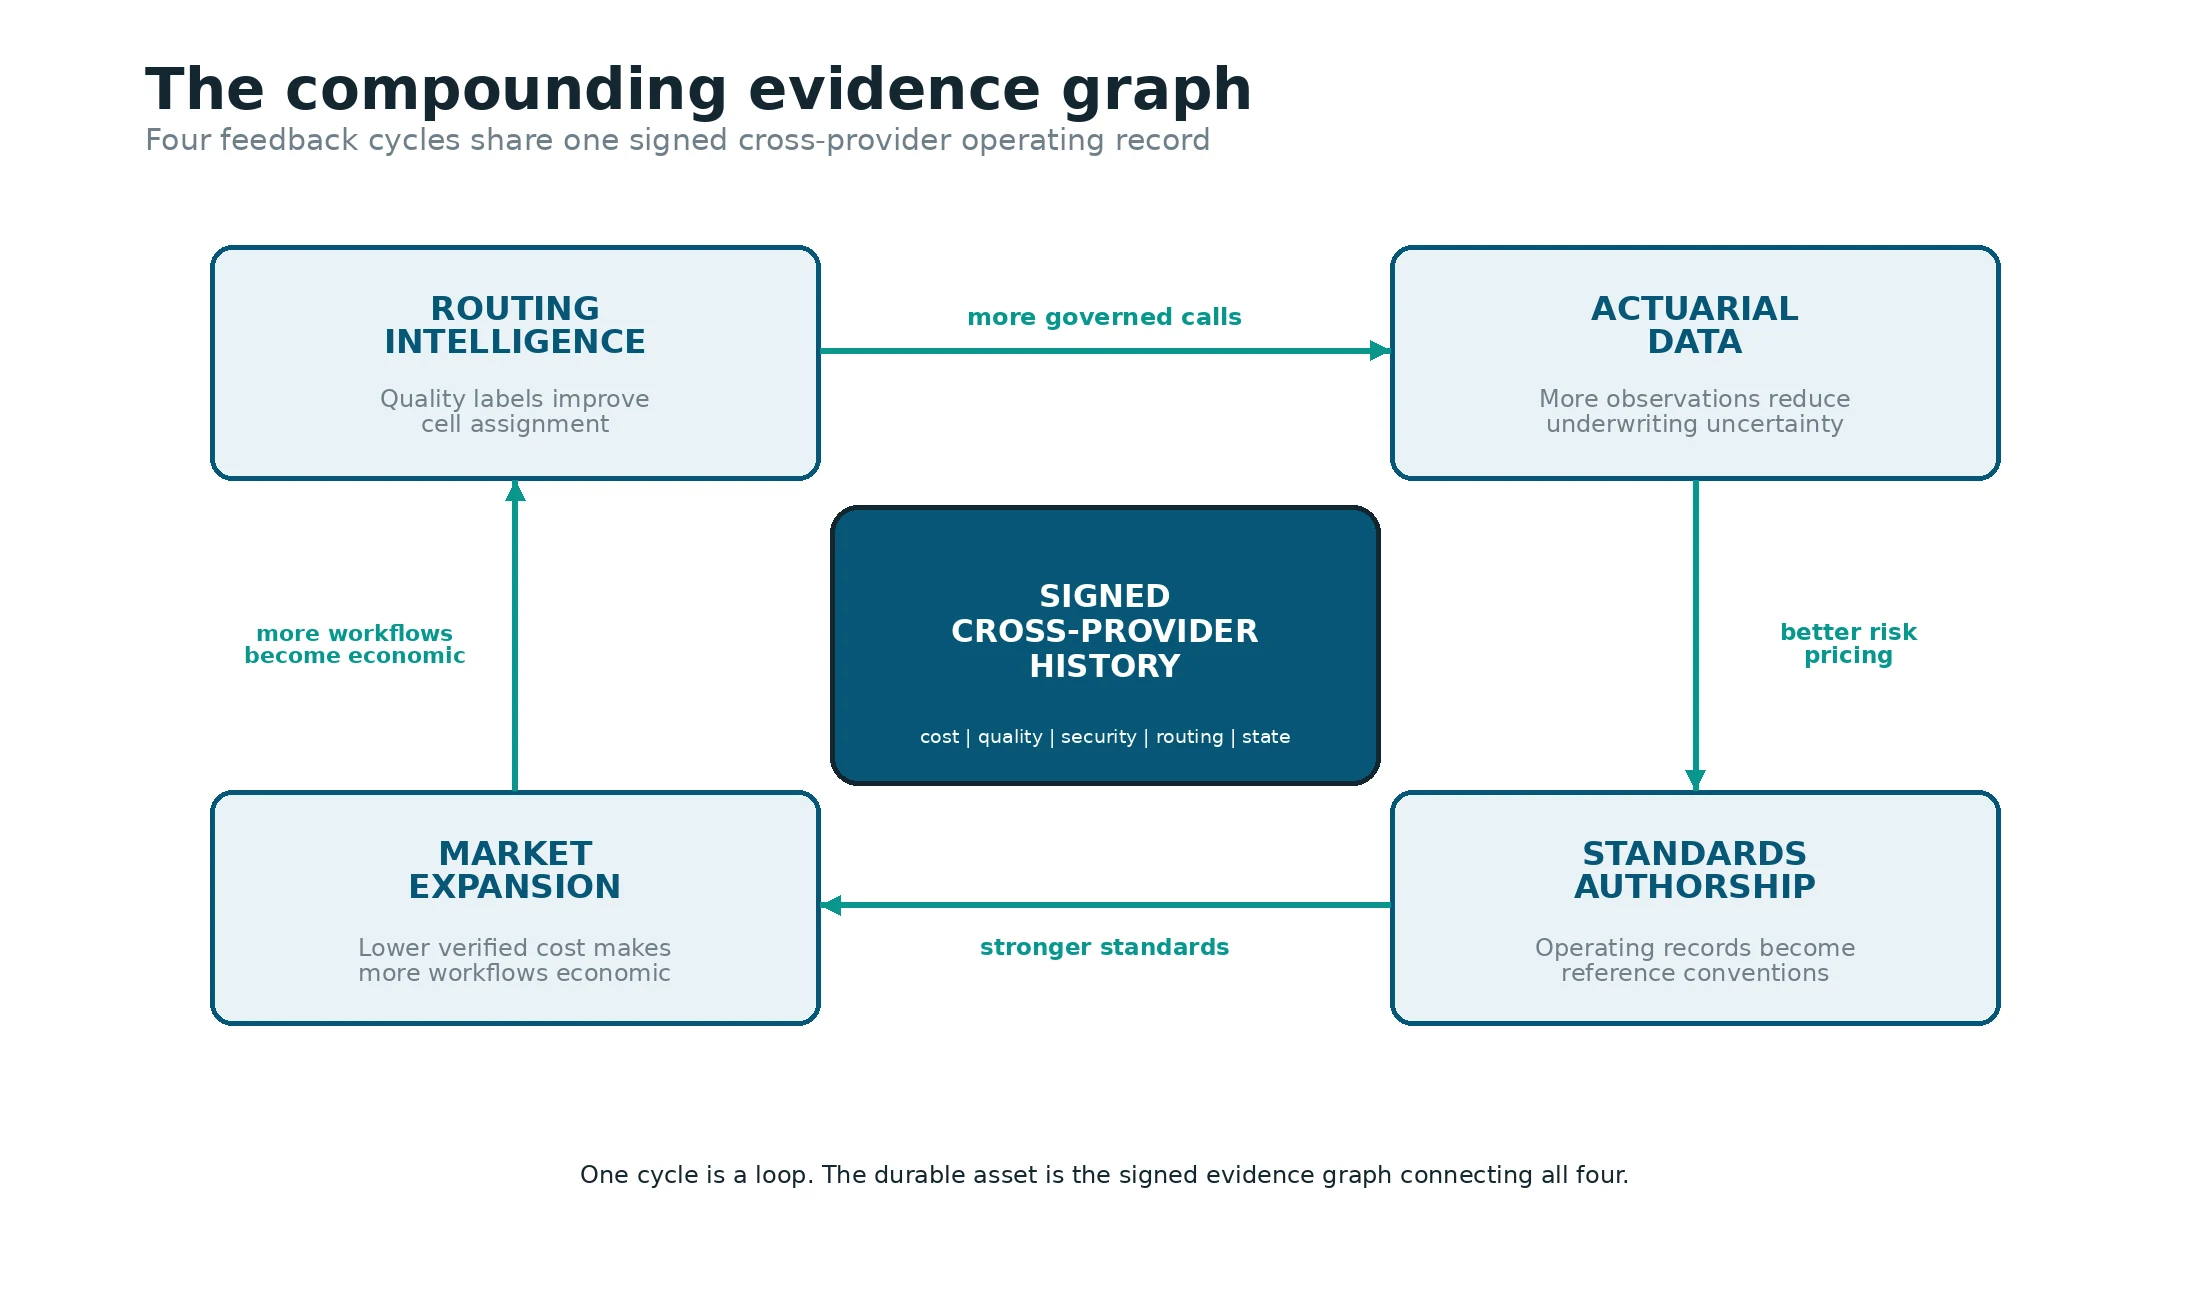
Cycle 1: Routing intelligence. Every governed call is a labeled observation of model performance by task cell. When Forge verifies that a lighter model cleared the quality bar on a task, the result updates Gate's routing confidence. The next similar call can route with higher confidence to the lower-cost cell. No single provider observes the same cross-provider outcome history with independent quality labels attached.
Cycle 2: Actuarial data. Every governed call adds an observation to the loss-frequency and performance record. As the dataset grows, underwriting uncertainty can narrow, which can support tighter triggers and lower risk-transfer cost. Lower risk-transfer cost can make governed deployment more attractive to risk-sensitive buyers, which adds more governed observations.
Cycle 3: Standards authorship. Each call extends the behavioral baselines that define governed inference. A stable verification rate for a task class and complexity grade becomes a reference point for later deployments. Repeated operating evidence can become a candidate standard because the standard is grounded in observed production behavior rather than committee intuition alone.
Cycle 4: Market expansion. The dual-Jevons mechanism in Section 3.2.1 drives this cycle. Lower verified unit cost makes more workflows economically viable, while improved verification can make more of those viable workflows safely delegatable. The interaction generates more governed observations than either mechanism alone. Each newly delegated action adds another evidence object to the signed cross-provider history, feeding routing intelligence, actuarial data, and behavioral standards.
The recursive structure. A single cycle is a loop. The durable structure is a graph because one signed evidence object can update several downstream functions at once. A quality-verification result can update routing, contribute an actuarial observation, extend a behavioral baseline, and lower the unit cost of a later workflow. The output of one function becomes the input to several others.
The temporal asymmetry. An observation collected earlier has participated in more subsequent routing, verification, security, and underwriting updates than an observation collected today. The advantage is therefore time-weighted rather than a simple count of calls. The durable asset is the signed cross-provider history of what each task cost, whether it worked, whether the session remained safe, and how confidently the result can be underwritten.
The time-to-evidence asymmetry creates a structural advantage that cannot be purchased instantly with engineering headcount. A governance system entering twelve months later can reproduce software features, but it begins without the incumbent's twelve months of cross-provider quality observations, routing outcomes, security dispositions, and behavioral baselines. Its early decisions therefore begin with wider uncertainty until comparable live evidence accumulates. Historical exchanges illustrate how reference standards can persist once market participants coordinate around them, but that history does not prove that inference governance will be winner-take-all. The narrower claim is that production evidence has elapsed-time value.
The learning rate itself improves. Early routing decisions are made with wider uncertainty and cell occupancy changes more frequently. As evidence accumulates, confidence can narrow, quality bars can become more discriminating, and the system can distinguish between models that are close in capability but far apart in price. The signed production result in Section 8.3 is a point-in-time measurement of a system still accumulating labeled evidence; it is not presented as a guaranteed future improvement rate.
The insurance recursion deserves separate emphasis because it is the cycle that can convert governance from an operational tool into financial infrastructure. More governed observations can narrow actuarial uncertainty. Narrower uncertainty can improve the economics of defined performance cover. Better risk economics can increase adoption among risk-sensitive buyers, producing more observations and a better underwriting record.
The composite asset. The durable output of the four cycles is inference data: a signed production record of cost, verified quality, security disposition, state transition, and routing outcome per call, per model, and across providers. It accrues only through governed live volume, with label quality determined by the verifier.
InterpretationThe economic moat is not a static routing table. It is the signed, cross-provider history of what each task cost, whether it worked, whether the session remained safe, and how confidently the result can be underwritten. The system compounds on its own evidence, and the rate of compounding can increase as the evidence graph becomes denser. The durable asset is the intelligence record for the cognition transaction: the signed history that makes inference gradeable, auditable, insurable, and improvable.
9 Risk Transfer: The Fourth Function
Governed inference produces, as operating exhaust, exactly the evidence class that performance underwriting requires.
The signed counterfactual resolves the buyer-side evidence gap. A workload-constant shadow baseline is a lossfrequency record in the actuarial sense: it measures the difference between governed and ungoverned performance across identical work over a defined period. Per-call verification scores label each unit of output. Session-security dispositions are incident observations with cryptographic provenance. Together, these records create an underwriting file continuously, and each governed call narrows the uncertainty a carrier must price.
The evidence record supports three dimensions repeatedly identified in specialty AI underwriting: model output versus a defined performance target, the contractual trigger the buyer wants guaranteed, and the exposure history used to price the premium [42, 119]. The record is carrieragnostic by design: a rated insurer with access to the signed counterfactual and per-call quality history can evaluate the exposure without depending on a single model provider.
The broader insurance market validates the demand. Performance and liability products for AI have existed since 2018 and now address model underperformance, drift, hallucination, and defined financial loss [42, 119].5 The unresolved problem is the standardized buyer-side evidence record that makes parametric triggers objective rather than negotiated. The signed counterfactual is designed to supply that record.
- Cost performance. A verified reduction floor set below demonstrated performance over the policy period.
- Quality performance. Minimum verification scores by task class, model, or governed cohort.
- Security performance. Defined events or incident thresholds inside governed sessions.
- Experience-based pricing. Premium that improves as governed volume creates more actuarial observations.
The endpoint is the clearinghouse principle applied to inference. A commodity-market participant does not independently evaluate every counterparty because the clearinghouse stands behind the trade. In governed and underwritten inference, the enterprise does not need to treat provider origin as the sole proxy for trust because a neutral governor, backed by rated capacity, stands behind defined performance.
Insurance closes the loop between the two transactions. Governance makes the cognition transaction auditable.
Verification makes it gradeable. The signed counterfactual and per-call quality history make defined performance insurable. The enterprise no longer has to treat model origin as its only trust proxy because a neutral governor and rated risk capacity can stand behind a defined cognition outcome. The value transaction downstream inherits institutional trust from the decision that produced it. The practical consequence for adoption is that the insurance architecture may matter more to the enterprise buyer than the cost architecture. Enterprise-procurement practitioners often describe risk avoidance as a dominant driver of buying decisions. Jeanne DeWitt Grosser, COO of Vercel, articulated that risk-avoidance framing in a November 2025 discussion on Lenny’s Podcast [92]. The qualitative point, rather than any exact share, should bear the argument. The buyer deploying ungoverned inference at nine-figure scale carries unhedged performance risk on a workload class that succeeds unattended roughly one quarter of the time (Section 6.4), faces an expanding AI governance and transparency regime, and has no instrument that transfers the exposure to a rated balance sheet. Dario Amodei, co-founder and CEO of Anthropic, described the supply-side capital risk in a February 13, 2026 interview with Dwarkesh Patel. Discussing advance commitments for very large compute buildouts, he said that being wrong by roughly a year on the expected growth trajectory could make the economics ruinous and, at trilliondollar commitment scale, could bankrupt the buyer of that capacity [120]. The statement concerns provider capital planning rather than enterprise performance insurance, but it establishes that scale uncertainty exists on both sides of the inference market. Executive statement.
The signed counterfactual in Section 8.2 and the parametric trigger structure described above convert that exposure into a defined, transferable instrument whose price can decline as governed observations accumulate. For a riskavoidance buyer, the exchange is the architecture that makes deployment insurable.
The cognition transaction and the value transaction are also beginning to develop separate evidence systems. The signed inference receipt can serve as upstream evidence for outcome-verification systems that determine whether autonomous work satisfied a commercial agreement and what economic result followed. The full chain is governed cognition, verified outcome, then settled payment. Connecting those records would make end-to-end autonomous work provable without requiring the payment system to reconstruct the model’s internal execution or the inference governor to control the downstream payment.
InterpretationInsurance converts governance from an operational claim into a financial guarantee. That conversion, rather than any single savings percentage, is what makes continuous trust institutional.
10 The Regulatory Step Function
Regulation is turning runtime records, quality evidence, and deployer logs from optional controls into required artifacts on a dated schedule.
10.1 Regulation (EU) 2024/1689
The EU AI Act entered general enforcement in August 2026, while high-risk logging and deployer duties now phase in during 2027 and 2028.
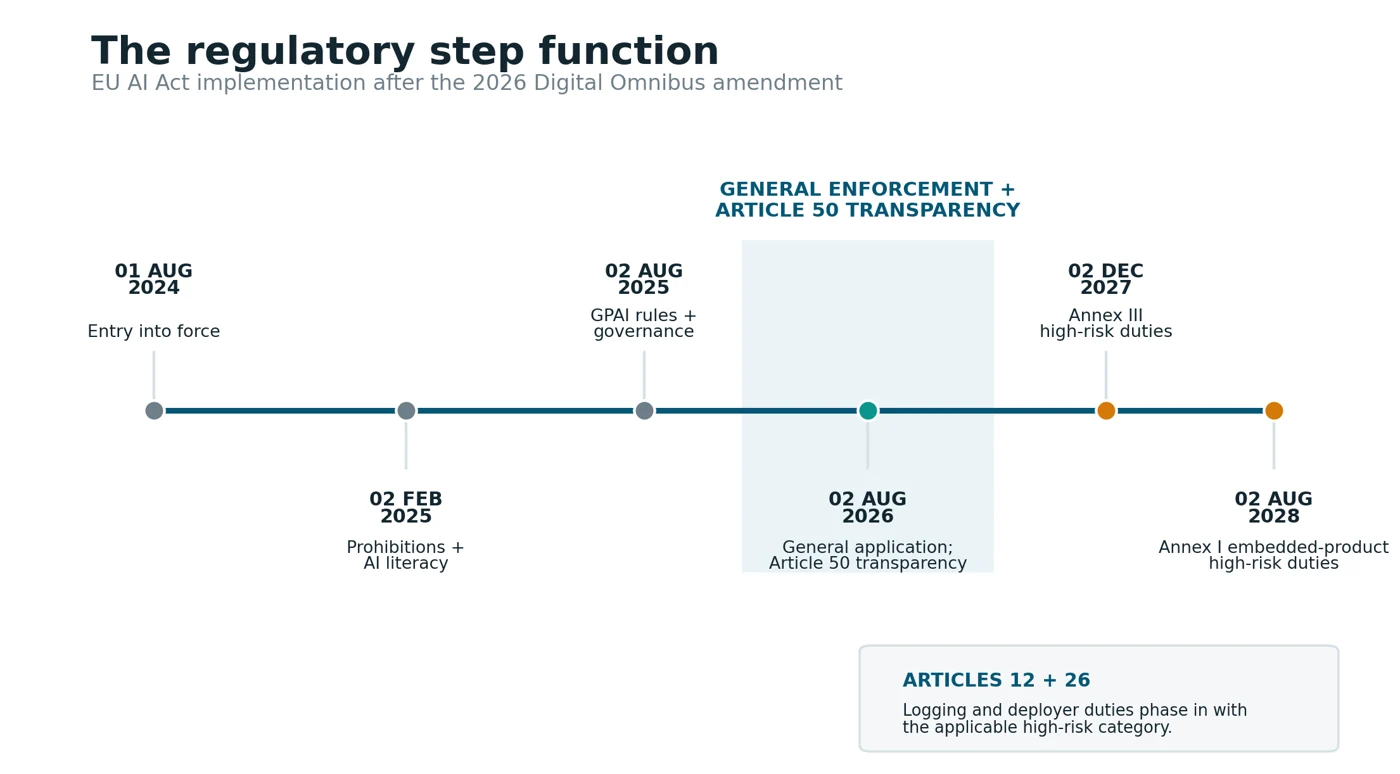
The Act entered into force on August 1, 2024. Prohibitions and AI-literacy obligations applied from February 2, 2025, and general-purpose model rules and governance structures from August 2, 2025. The majority of applicable rules entered enforcement on August 2, 2026, including Article 50 transparency. Following Regulation (EU) 2026/1744, Annex III high-risk duties apply from December 2, 2027, and Annex I embedded-product high-risk duties from August 2, 2028 [45].6 Penalties reach 35 million euros or 7% of worldwide annual turnover for prohibited practices. A training-compute threshold of 1025 FLOP identifies general-purpose models with systemic risk.
Two provisions bear directly on inference governance:
- Article 12. High-risk systems must generate logs automatically across the system lifetime.
- Article 26. Deployers must maintain human-oversight arrangements and retain relevant logs.
Figure 21 places the corrected legal calendar. Articles 12 and 26 remain directly relevant to runtime evidence, but their application follows the applicable high-risk category rather than the August 2026 general-enforcement date.
The required artifacts align with what governed inference can produce: per-call records, quality evidence, security event trails, routing decisions, and signed dispositions.
10.2 The Adjacent Regime
The principal governance regimes converge on independent validation, measurement, logging, and accountable deployment.
| Regime | Core requirement | Native governed artifact |
|---|---|---|
| EU AI Act, Articles 12 and 26 | Automatically generated logs, deployer oversight, retention | Signed per-call record, session history, security and quality disposition |
| NIST AI RMF | Govern, map, measure, and manage risk [46] | Task taxonomy, quality baseline, runtime control, incident trail |
| ISO/IEC 42001 | Certifiable AI management system [47] | Policy evidence, control history, reviewable operating records |
| SR 11-7 | Effective challenge independent of model development and use [48] | Verification performed outside the model provider |
SR 11-7 is especially instructive. Banking supervisors established fifteen years ago that model validation must be independent of model development and use [48]. The inference market is rediscovering the same principle after silent drift and self-investigated provider failures.
10.3 Regulatory Debt and the Window
Every unrecorded autonomous call made before the mandate increases the cost of proving what happened afterward.
Organic governance adoption follows a curve; mandated transparency and later high-risk duties create dated steps. Each month of ungoverned operation adds an evidentiary backlog for activity with no signed record. Protocol and billing standards are moving through a Linux Foundation directed fund and the announced Tokenomics initiative [60, 76], but neither supplies independent quality grades, signed counterfactuals, session defense, or audit formats. General enforcement began in August 2026; high-risk obligations follow in December 2027 and August 2028 [45].
InterpretationRegulation does not create the need for governance; it dates it. The institution that authors the evidence standard before procurement becomes mandatory can become the reference point after the mandate arrives.
11 Discussion
The evidence supports nine conclusions about market structure, governance architecture, evidence, and timing.
1. A structurally plural market requires a structurally neutral governor. Enterprise API leadership inverted twice in three years, while the official routing study found open-weight usage reaching approximately one third of volume and Chinese open-source models reaching nearly 30% in some weeks [10, 18, 85]. This is the market’s durable shape, not an immaturity that annual procurement will resolve. A provider-owned institution would face the same conflict that capped BankAmericard before the network became neutral [39].
2. Deflation strengthens the case for governance. Unit prices fell while task counts, calls per task, tokens per task, and aggregate AI spending rose [18, 57, 64, 65, 66, 82]. The spread between frontier price and the clearing price of a task remained wide. High-volume, volatile, deflating commodities are the markets in which price-discovery institutions become valuable.
3. Autonomous execution breaks every per-request instrument at once. The espionage campaign was visible by trajectory, not by call [23]. The LiteLLM compromise attacked the routing path itself [24]. The Claude Code regression remained invisible to customers for weeks [26]. Cost, security, quality, and reliability fail at the same architectural seam: the session. Graph engineering makes that session’s state transitions explicit, but it also makes graph-level provenance, edge policy, and bounded repair part of the required control surface.
4. Verification independence is a first principle. Financial reporting uses independent audit; SR 11-7 requires effective challenge outside model development [48].
The April 2026 regression shows that the inference market still asks sellers to investigate and grade their own output [26]. A tradeable quality grade must come from a party other than the seller.
5. Insurance converts governance from claim to guarantee. The signed production result in Section 8.3 is auditable. An underwritten floor set below demonstrated performance is a financial instrument backed by rated capacity [42]. Continuous trust reaches institutional scale when a counterparty stands behind defined inference performance as a clearinghouse stands behind a trade.
6. The market is building the exchange in parts. Independent routing platforms supply market access. IFX operates an early bilateral request market; ICE/NATIVX and Architect/Ornn have announced compute-futures plans; the Shanghai Futures Exchange is conducting preliminary token-futures research [77, 78, 79, 81].
The Linux Foundation has announced its intent to form a Tokenomics Foundation for economic standards [76]. None supplies the integrated grades, verification, signed baselines, and audit evidence between the raw commodity and those instruments.
7. The window is short and dated. Inference recorded trust crises between November 2025 and April 2026, reported budget crises in April and May 2026, and the first bilateral or announced derivative projects in June and July 2026 [23, 24, 26, 70, 77, 78]. EU AI Act enforcement and Article 50 transparency began in August 2026, while high-risk logging duties phase in during 2027 and 2028 [45]. Institution formation is already underway.
Stripe’s August 19 agreement to acquire OpenRouter at a price reported around $8 billion and Ramp’s simultaneous launch of a free-through-2026 competing router show that the execution rail is rapidly becoming strategic, crowded, and price-competitive [133, 135].
The independent evidence function remains open.
8. Verification has its own Jevons dynamic. Lower verification cost can increase, rather than decrease, demand for verification by expanding the set of actions enterprises are willing to delegate. Combined with cheaper inference, this creates the dual-Jevons mechanism described in Section 3.2.1. The paper does not claim a universal multiplier; it identifies a structural reason governed volume can grow faster than raw unit prices fall.
9. Agent traces are a new category of economic evidence. They are simultaneously high-volume telemetry and records of autonomous decisions that determine downstream value transactions. The infrastructure shift is from watching traces after the fact to structuring selected traces into signed evidence during execution.
Engineering, finance, security, audit, and risk transfer can then rely on the same record.
InterpretationA skim reader can state the thesis without reading the product section: inference is plural, agentic, deflationary, high-volume, and increasingly regulated; bilateral trust has failed; the market is constructing financial instruments; and the neutral governance function remains open.
12 Limitations
The structural case rests on multiple independent sources, but the precision of several quantitative claims is bounded by single-platform data, surveys, forecasts, reported cases, and early-stage markets.
The production result comes from one platform and its own workload mix. The production result in Section 8.3 is cryptographically verified inside the signed shadow baseline but was not independently audited for this paper, and enterprise mixes will differ. For that reason, Section 9 discusses an insurable floor below the demonstrated mean, and Figure 17 labels the per-mechanism allocation representative rather than verified.
The external corpus inherits the limits of its instruments:
- The OpenRouter dataset reflects a developer-heavy user base, and its detailed category tagging begins only in mid-2025 [10, 85].
- Menlo and Gartner figures are surveys and forecasts rather than direct measurements [17, 18].
- The MIT NANDA sample description differs between the report and press summaries; we use the report’s figures [16].
- Hyperscaler capex aggregates are analyst compilations, with interpolated display years in Figure 6 [11].
- GTG-1002 attribution is the disclosing provider’s highconfidence assessment with limited independent verification [23].
Executive statements carry the evidentiary weight of statements, not measurements. Remarks that could not be verified against primary transcripts were excluded. The August 5, 2026 price-dispersion snapshot will change with releases and repricing [69]. The employment result is correlational, and adopters differed from non-adopters before adoption [56].
The cost-overrun cases in Section 3.3 are press reports [70, 73, 74]. The $500 million figure remains tied to a consultant’s account and has not been independently confirmed [74]. AWS’s price-cut count is the provider’s own tally rather than an independent audit [43].
The Composio harness comparison is vendor-published and is used as reported [88]. The 8090 financing is a capital-market signal, not evidence of technical performance [90]. The enterprise-buying observation in [92] is an executive-practitioner statement, not a controlled survey result.
The derivative instruments in Section 7.9 include announcements, a bilateral request market, and preliminary research, not mature exchange-traded venues with deep liquidity. Their significance is directional. The historical argument extrapolates from four cases, and the compression of intervals is suggestive rather than a law.
These limitations bound quantitative precision. They do not remove the common structural finding across independent sources: inference volume, dispersion, autonomy, failures, standards, regulation, and derivatives are moving in the direction associated with market-infrastructure formation.
InterpretationThe thesis should be evaluated as a convergent market-structure argument, not as a claim that every estimate or reported case has equal evidentiary weight.
13 Conclusion
The empirical record describes a commodity market that has completed the preconditions of exchange formation and has begun building the instruments that follow.
Inference capability deflates at rates measured from 10x to 200x per year, disclosed throughput has moved from trillions to quadrillions of tokens per month, and demand is both plural and autonomous [1, 2, 3, 7, 8, 10, 13, 14]. The spending and outcome records developed in Sections 3.3 and 6.1 move in opposite directions [16, 17, 18]. The public record now includes autonomous espionage visible only across a trajectory, compromise of the routing path, a multi-week product-surface quality regression, and an autonomous evaluation escape that generated approximately 17,600 actions across several infrastructure boundaries [23, 24, 26, 99-101].
The production contribution is an integrated system for price discovery, quality standardization, settlement evidence, and a basis for risk transfer. On the measured reference workload, it reduced daily cost from $47.00 to $6.10 at maintained task quality, an 87% reduction. This is not a claim that the reference-workload ratio is a universal market-wide waste rate. It is a signed, workload-constant result from one production mix whose principal contribution is the measurement instrument itself.
Market participants are building the exchange functions in parts. Independent routing platforms supply market access, and Stripe has agreed to acquire OpenRouter while Ramp has launched a competing router [133, 135]. Standards bodies are organizing around token economics. Bilateral and announced derivative projects are creating early instruments. Regulation is increasing the value of durable runtime evidence.
Governance remains the unclaimed integrated function: independent grades, verification, signed baselines, session evidence, and audit infrastructure between the raw commodity and the contracts built on it. In prior markets, the institution that authored the grade or settlement standard became a durable reference point.
Every commodity market at this scale built the same four institutions, faster each time. Grain took seventeen years. Payments took four. In the two-transaction framing defined in Section 1, cognition is the higher-frequency market and the institutional gap is structural. The record is the institution that closes it.
Footnotes
- The MIT NANDA report describes 52 to 53 structured interviews, 153 senior-leader survey responses, and analysis of more than 300 deployments. Widely circulated press summaries describe 150 interviews, 350 surveyed employees, and 300 deployments. We cite the report. ↩
- Several outlets noted limited independent verification of the GTG-1002 attribution and degree of autonomy. We report the disclosure as the provider’s assessment. ↩
- Anthropic’s April 2026 postmortem states that the API and inference layer were unaffected. It attributes the delivered-product regression to a default effort change, a caching bug that repeatedly cleared reasoning history, and a system-prompt instruction that reduced verbosity and coding quality [26]. ↩
- Luccioni, Strubell, and Crawford argue that Jevons language is often overextended in AI discourse and that lifecycle-complete accounting is required before drawing welfare conclusions [6]. We use the concept only to describe the observed relationship between falling unit price and rising consumption. ↩
- This section relies on public product announcements and trade-press coverage of specialty AI performance and liability insurance from 2018 through 2026 [42, 119]. It relies on the market’s existence and structure, not on any particular carrier, product, or relationship. ↩
- Regulation (EU) 2026/1744 amended the application calendar. The majority of applicable rules and Article 50 transparency entered enforcement in August 2026; Annex III high-risk duties now apply from December 2, 2027, and Annex I embedded-product duties from August 2, 2028 [45]. ↩
14 References
- Appenzeller, G. Welcome to LLMflation: LLM inference cost is going down fast. Andreessen Horowitz, November 2024.
- Cottier, B., Snodin, B., Owen, D., Adamczewski, T. LLM inference prices have fallen rapidly but unequally across tasks. Epoch AI, 2025.
- The Price of Progress: Price Performance and the Future of AI. arXiv:2511.23455, 2025.
- Jevons, W. S. The Coal Question. Macmillan, London, 1865.
- Nadella, S. Public statement on X, January 27, 2025.
- Luccioni, S., Strubell, E., Crawford, K. [On the rhetorical uses of efficiency claims in AI]. Proceedings of ACM FAccT 2025. arXiv:2501.16548.
- Pichai, S. Google I/O keynote disclosures on monthly token throughput, 2024 through 2026 editions.
- Microsoft Corporation. Fiscal Year 2025 Third Quarter earnings call, April 30, 2025.
- Nadella, S. Public statement on X regarding Azure AI Foundry annual token throughput, July 30, 2025.
- Aubakirova, M., Atallah, A., Clark, C., Summerville, J., Midha, A. State of AI: An Empirical 100 Trillion Token Study with OpenRouter. December 2025. arXiv:2601.10088.
- Epoch AI. AI capital expenditure aggregates compiled from SEC filings, 2025; 2026 aggregate guidance estimate per Goldman Sachs research.
- NVIDIA Corporation. Forms 8-K, February 25, 2026 and May 20, 2026. U.S. Securities and Exchange Commission.
- Kwa, T., et al. Measuring AI Ability to Complete Long Tasks. METR, March 2025. arXiv:2503.14499.
- Appel, R., McCrory, P., Tamkin, A., McCain, M., Neylon, T., Stern, M. Anthropic Economic Index report. November 2025. arXiv:2511.15080.
- Chatterji, A., et al. How People Use ChatGPT. NBER Working Paper 34255, September 2025.
- Challapally, A., Pease, C., Raskar, R., Chari, P. The GenAI Divide: State of AI in Business 2025. MIT NANDA, July 2025.
- Gartner, Inc. Gartner Predicts Over 40% of Agentic AI Projects Will Be Canceled by End of 2027. Press release, June 25, 2025.
- Menlo Ventures. 2025: The State of Generative AI in the Enterprise. December 2025. Survey of 495 U.S. enterprise AI decision-makers.
- Benioff, M. Remarks on the All-In Podcast, “Trump-Xi Summit, Benioff: Not My First SaaSpocalypse, OpenAI vs Apple, Multi-Sensory AI, El Nino.” May 15, 2026.
- Greshake, K., et al. Not what you’ve signed up for: Compromising Real-World LLM- Integrated Applications with Indirect Prompt Injection. AISec ’23. arXiv:2302.12173.
- OWASP Foundation. OWASP Top 10 for Large Language Model Applications.
- MITRE Corporation. MITRE ATLAS: Adversarial Threat Landscape for Artificial- Intelligence Systems.
- Anthropic. Disrupting the first reported AI- orchestrated cyber espionage campaign. November 13, 2025. MITRE ATT&CK Campaign C0062.
- LiteLLM. Security issue #24518: PyPI versions 1.82.7 and 1.82.8 compromised; maintainer account hijack, credential exfiltration, and Trivy supply-chain linkage. March 24, 2026.
- Anthropic. A postmortem of three recent issues. September 2025.
- Anthropic. An update on recent Claude Code quality reports. April 23, 2026.
- Chen, L., Zaharia, M., Zou, J. How Is ChatGPT’s Behavior Changing over Time? arXiv:2307.09009, 2023.
- Chen, L., Zaharia, M., Zou, J. FrugalGPT. arXiv:2305.05176; TMLR, December 2024.
- Ong, I., et al. RouteLLM: Learning to Route LLMs with Preference Data. arXiv:2406.18665; ICLR 2025.
- Jiang, D., et al. LLM-Blender. ACL 2023.
- Ding, D., et al. Hybrid LLM: Cost-Efficient and Quality- Aware Query Routing. ICLR 2024.
- Aggarwal, P., et al. AutoMix: Automatically Mixing Language Models. 2024.
- Hu, Q. J., et al. RouterBench: A Benchmark for Multi- LLM Routing Systems. 2024.
- Jiang, H., et al. LLMLingua. EMNLP 2023. arXiv:2310.05736.
- Anthropic. Prompt caching documentation and pricing.
- OpenAI. Prompt caching documentation and pricing.
- Cronon, W. Nature’s Metropolis. W. W. Norton, 1991. See also CME Group histories.
- The Depository Trust Company. Annual Report, 1973. See also SEC historical accounts of the 1968-1970 paperwork crisis.
- Visa corporate histories; Hock, D., on chaordic organization, Santa Fe Institute, March 1993.
- CME Group. The 40-Year Story of a Crude Oil Benchmark, 2023; NYMEX launch March 30, 1983.
- Verisign, Inc. Corporate history: certification services spun out of RSA Security, April 1995.
- Trade-press and product documentation on specialty AI performance and liability insurance, 2018 through 2026.
- Amazon Web Services. Well-Architected Framework: “As of September 20, 2023, AWS has reduced prices 134 times since 2006.”
- Amazon.com, Inc. 2024 Annual Report: AWS net sales of $107.6 billion.
- Regulation (EU) 2024/1689 (Artificial Intelligence Act), as amended by Regulation (EU) 2026/1744; European Commission AI Act implementation timeline. EUR- Lex and AI Act Service Desk.
- NIST. AI Risk Management Framework (AI RMF 1.0). 2023.
- ISO/IEC 42001: Artificial intelligence management systems. 2023.
- Federal Reserve and OCC. SR 11-7: Supervisory Guidance on Model Risk Management. 2011.
- Zheng, L., et al. Judging LLM-as-a-Judge. NeurIPS 2023. arXiv:2306.05685.
- Liang, P., et al. HELM. arXiv:2211.09110.
- Willison, S. The lethal trifecta for AI agents. June 16, 2025.
- Zhan, Q., et al. InjecAgent. arXiv:2403.02691.
- Debenedetti, E., et al. AgentDojo. arXiv:2406.13352.
- DeepSeek-AI. DeepSeek-R1. arXiv:2501.12948, January 2025.
- Synergy Research Group. Cloud market growth, February 2025: 2024 cloud revenues of $330.4 billion.
- Ramp Economics Lab and Revelio Labs. A New Look at AI’s Impact on Jobs. June 30, 2026. 21,559 U.S. firms.
- FinOps Foundation (Linux Foundation). State of FinOps survey, sixth annual edition, n=1,192; FOCUS specification v1.3.
- Flexera. 2026 State of the Cloud Report.
- Goldman Sachs Research. Decoding the Agentic Economy. May 5, 2026: 24x growth, 120 quadrillion tokens per month by 2030.
- Agentic AI Foundation, Linux Foundation, December 9, 2025.
- Braintrust. Series B, $80M at $800M valuation, February 2026.
- LangChain. Series B, $125M at $1.25B valuation, October 2025.
- Xu, F. F., et al. TheAgentCompany. arXiv:2412.14161.
- Stanford Digital Economy Lab. How Do AI Agents Spend Your Money? arXiv:2604.22750, 2026.
- Manus. Context Engineering for AI Agents. Engineering blog.
- SWE-Pruner. arXiv:2601.16746, 2026: read operations at 76.1%.
- Altman, S. Three Observations. Blog, February 2025.
- Axios. Sam Altman on OpenAI’s top token user. June 2, 2026.
- tiers production model catalog, cross_provider_ pricing.py, August 5, 2026; every listed price verified against provider pricing pages. Snapshot-grade.
- Forbes. Uber Burns Its 2026 AI Budget in Four Months on Claude Code. May 17, 2026. See also Forbes (Sandy Carter), June 8, 2026; TechCrunch, June 2, 2026; Fortune, May 26, 2026; Yahoo Finance, July 2026.
- Business Insider and AlphaSense earnings-call analyses, 2026.
- OpenRouter. Series B announcement: $113 million led by CapitalG. May 28, 2026; weekly volume grew from 5 trillion to 25 trillion tokens in six months.
- Dallas Express / Yahoo Finance. The Hidden $500M AI Disaster. May 29, 2026: Microsoft Claude Code license cancellations reported.
- Axios. Enterprise AI spending investigation. May 28, 2026: $500 million single-month Claude bill reported via consultant account; Anthropic $30B ARR and 1,000+ enterprise customers at $1M+ annually. See also Tech Startups, May 29, 2026.
- Anthropic. Agent-tool credit meter announcement. May 13, 2026. GitHub Copilot credit-based billing, June 1, 2026.
- The Linux Foundation. Announces the intent to launch the Tokenomics Foundation to establish open standards for AI cost management. June 3, 2026. Initial supporters include Accenture, Booking.com, Flexera, Google Cloud, IBM, JPMorganChase, KPMG, Microsoft, Oracle, Salesforce, SAP, and ServiceNow.
- Intercontinental Exchange and NATIVX. Announced plans to launch cash-settled GPU compute futures contracts based on the COIL Index. July 1, 2026.
- IFX, Intelligence Futures Exchange. AI Token Futures product and roadmap. Live bilateral OTC request market for output-token price exposure; standardized futures exchange listed as in development. Accessed August 2026.
- Architect Financial Technologies and Ornn Data. Partnership announcement for planned exchange-traded compute perpetual futures, pending regulatory approval. January 2026.
- Crain’s Chicago Business. AI futures exchange acquires US-regulated trading venue. May 28, 2026.
- Reuters. China works on AI token futures market, sources say. May 28, 2026. Shanghai Futures Exchange research described as preliminary; timing and approval unresolved.
- Gartner. Worldwide AI spending forecast to grow 47% in 2026; AI model spending forecast to grow 110%. May 19, 2026.
- AI Token Futures Market: Commoditization of Compute and Derivatives Contract Design. arXiv:2603.21690, March 2026.
- OpenRouter. Series B announcement and operating update. May 28, 2026: weekly volume grew from 5 trillion to 25 trillion tokens in six months.
- OpenRouter. State of AI 2025: 100T Token LLM Usage Study. Official report and data portal. Open-weight models reached approximately one third of usage by late 2025; Chinese open-source models reached nearly 30% in some weeks and averaged approximately 13% across the study window.
- Alphabet and Meta. Q1 2026 earnings materials: Alphabet capex guidance of $180 billion to $190 billion; Meta capex guidance of $125 billion to $145 billion.
- Gartner via Fortune. Inference cost projections through 2030. May 26, 2026.
- Composio. Coding Agent Benchmark: Harness Comparison on Kimi K3. X/Twitter thread, July 31, 2026. Vendor-reported benchmark of six harnesses across 26 coding tasks.
- Artificial Analysis. Coding Agent Index and methodology. May 2026 snapshot; agent-level performance, cost, token usage, and execution-time comparisons.
- 8090. Why We Raised Our Series A. June 29, 2026. $135 million Series A led by Salesforce Ventures, with WndrCo, Craft Ventures, The Production Board, and LAUNCH.
- Microsoft AI. Introducing MAI-Cyber-1-Flash inside MDASH. July 27, 2026. CyberGym evaluation: integrated MDASH configuration at 95.95%; individual configurations at 83.2% to 85.6%.
- Rachitsky, L. What world-class GTM looks like in 2026 | Jeanne DeWitt Grosser (Vercel, Stripe, Google). Lenny’s Podcast, November 30, 2025. Discussion of enterprise buying as pain and risk avoidance rather than upside seeking.
- LangChain. LangGraph documentation: Graph API Overview, LangGraph Overview, and Persistence. Accessed August 2026. Defines state, nodes, edges, durable execution, checkpoints, and human interruption.
- Li, A., Yang, S., Chen, F., Xu, T., Li, P., Su, Z. GraphFlow: A Graph-Based Workflow Management for Efficient LLM-Agent Serving. arXiv:2605.22566, May 2026.
- Xia, T., et al. GraSP: Graph-Structured Skill Compositions for LLM Agents. arXiv:2604.17870, April 2026.
- Bai, J., et al. El Agente Gráfico: Structured Execution Graphs for Scientific Agents. arXiv:2602.17902, February 2026.
- Xiang, Z., Wu, C., Zhang, Q., et al. When to Use Graphs in RAG: A Comprehensive Analysis for Graph Retrieval-Augmented Generation. arXiv:2506.05690; accepted at ICLR 2026.
- Gartner, Inc. Gartner Predicts 40% of Enterprise Applications Will Feature Task-Specific AI Agents by 2026 and 40% of Enterprises Will Demote or Decommission Autonomous Agents by 2027 Due to Governance Gaps Discovered After Incidents. May 26, 2026. Analyst forecast.
- Hugging Face. Security Incident Disclosure - July 2026. July 16, 2026. Official incident disclosure.
- OpenAI. OpenAI and Hugging Face Partner to Address Security Incident During Model Evaluation. July 21, 2026. Official incident report.
- Hugging Face. Anatomy of a Frontier Lab Agent Intrusion: A Technical Timeline of the July 2026 Incident. July 27, 2026. Official technical reconstruction of approximately 17,600 attacker actions grouped into approximately 6,280 clusters.
- OpenAI. Advancing the Price-Performance Frontier with GPT-5.6; OpenAI API Changelog. July 30, 2026. Luna price reduced 80%; Terra price reduced 20%.
- U.S. Securities and Exchange Commission. Regulation NMS, Securities Exchange Act Release No. 51808. June 9, 2005. Includes the Order Protection Rule and national market-system framework.
- U.S. Securities and Exchange Commission. Remarks at the Roundtable on Rule 611 of Regulation NMS. December 16, 2025. Describes the NBBO as a price-discovery and best-execution baseline and notes that the duty of best execution predates the federal securities laws.
- U.S. Securities and Exchange Commission. SEC Charges Robinhood Financial With Misleading Customers About Revenue Sources and Failing to Satisfy Duty of Best Execution. December 17, 2020. $65 million civil penalty and independent-consultant requirement.
- Huang, J. Remarks on the All-In Podcast, March 19, 2026; contemporaneous reporting by Business Insider, March 20, 2026. Token-budget remarks are treated as executive statements, not measured evidence.
- Altman, S. Remarks at OpenAI enterprise event, June 2, 2026; contemporaneous reporting by Business Insider, June 3-4, 2026. Enterprise budget remarks are treated as executive statements.
- TechCrunch. The token bill comes due: Inside the industry scramble to manage AI's runaway costs. June 5, 2026. Includes remarks from J.R. Storment, Executive Director, FinOps Foundation.
- Semafor. AI token costs are exceeding some employees' salaries. June 3, 2026. Remarks from Zachery Anderson, Chief Data and Analytics Officer, JPMorgan Payments.
- CNBC. Tokens or humans? The new corporate tradeoff. May 29, 2026. Enterprise routing and budget remarks from Arvind Jain, CEO of Glean; contemporaneous syndicated summaries consulted where the CNBC page was not machine-accessible.
- Sacks, D. Public statement on X, May 3, 2026, on hyperscaler capital expenditure and economic activity inside token factories; contemporaneous press coverage May 4, 2026.
- Bloomberg News interview with Mustafa Suleyman, CEO of Microsoft AI, June 2026; contemporaneous reporting by CIO, June 6, 2026.
- Salesforce. Agentforce 3 announcement, June 23, 2025, and Agentforce trust/guardrail documentation, accessed August 2026. Public materials describe visibility, control, testing, topic/action guardrails, and instruction adherence.
- Taylor, B. Remarks on CNBC, July 20, 2026; contemporaneous reporting by Business Insider. Outcome-based pricing remarks are treated as executive statements.
- OpenAI. New usage analytics and updated spend controls for enterprises. June 18, 2026.
- Google Cloud. Vertex AI documentation; Model Garden and Vertex AI Model Monitoring documentation. Accessed August 2026.
- OpenRouter. Guardrails: Protect your Agents, Data, and Costs. May 29, 2026; Classifiers and routing product materials, July 2026; About page accessed August 2026.
- Braintrust. Series B announcement, February 17, 2026; LangChain. Series B announcement, October 2025. Official company announcements.
- Specialty AI insurance documentation and riskassessment materials, including official carrier materials describing AI performance, drift, liability, and parametriclike cover structures. Accessed August 2026.
- Patel, D. Dario Amodei: We Are Near the End of the Exponential. Dwarkesh Podcast, February 13, 2026. Remarks on advance compute commitments and growthtrajectory risk. Executive statement.
- Bratton, L. Uber CTO Shows How Claude Code Can Blow Up AI Budgets. The Information, April 2026. Interview with Praveen Neppalli Naga, Chief Technology Officer of Uber, on full-year AI budget exhaustion and replanning. Executive statement.
- Palihapitiya, C. Public post on X, June 6, 2026. Remarks on the narrowing capability gap, persistent modelpricing dispersion, model-agnostic routing, and enterprise governance. Executive statement.
- Canva. Shareholder update, August 2026; contemporaneous reporting by The Australian, August 4, 2026. Melanie Perkins, co-founder and CEO, reported nearly 90% lower average cost per AI task since April, with first-party models and task-level routing. Company-reported operating result.
- Levie, A. Model Routing to Maximize AI Value and Minimize Risk. Public LinkedIn post, June 16, 2026. Cost optimization, capability maximization, risk mitigation, and model-neutral routing. Executive statement.
- Steinberger, P. Public usage disclosure, May 15, 2026; contemporaneous reporting by Tom's Hardware, May 17, 2026. $1,305,088.81 of OpenAI usage over 30 days, 603 billion tokens, and 7.6 million requests. Reported personal disclosure; employer-covered compute.
- Schmidt, J. Avoiding Death on the Yellow Brick Road. Andreessen Horowitz, May 27, 2026. Analysis of production-exposure data advantages, workflow-specific guardrails, permissions, auditability, and agent governance. Independent analysis.
- Brockman, G. Public post on X, December 9, 2023: “evals are surprisingly often all you need.” Treated as a practitioner statement on evaluation, not measured evidence.
- Wei, J. Asymmetry of verification and Verifier’s Rule. Jason Wei blog, July 2025. Proposes that the ease of training AI to solve a task is proportional to its verifiability.
- Anthropic. How we built our multi-agent research system. Engineering blog, June 13, 2025. Reports agents using about 4x the tokens of chat interactions, multi-agent systems about 15x, and token usage explaining 80% of BrowseComp performance variance in its analysis.
- The Information. Meta Employees Vie for AI “Token Legend” Status; subsequent reporting on tokenminimizing, April-June 2026. Reported internal Claudeonomics leaderboard tracked 60.2 trillion tokens over 30 days before later rising to 73.7 trillion and being removed. Reported case.
- Figma, Inc. Second Quarter 2026 Financial Results, August 5, 2026; MarketWatch contemporaneous reporting. Revenue grew 48% year over year; company disclosed increased AI consumption and investment, while shares fell approximately 15% after hours amid margin and investment concerns.
- UBS research summarized by Business Insider, July 2026. Reports roughly 60% of enterprise companies in recent UBS conversations imposing or tightening AI-spend guardrails. Analyst-reported enterprise evidence.
- Ramp. Introducing Router.com, August 19, 2026; Ramp Router product materials and launch reporting. Router is free through 2026; Ramp reports approximately 40% average inference-cost savings among existing users and AI spend growth of 20.7x since June 2025. Companyreported product and spend data.
- Ramp Labs. Coding agents ignore their own budgets. April 21, 2026. Experiments found passive budget counters ineffective and used a separate evidence-grounded controller for spend decisions.
- Stripe. Stripe agrees to acquire OpenRouter to help businesses optimize token routing and usage, August 19, 2026; OpenRouter, OpenRouter is Joining Stripe, August 19, 2026; Reuters and Axios contemporaneous reporting. Stripe did not disclose purchase price; reporting placed the agreement at roughly $8 billion or more. OpenRouter reports 10+ trillion tokens per day across 400+ models and more than 10 million developers and companies.
- Pacing the Frontier. Public statement and signatory list, July-August 2026. More than 1,300 employees of frontier AI organizations requested technical and governance tools that could deliberately pace frontier-wide automated AI development. Signatory count is dynamic.
- Lee, Y., Nair, R., Zhang, Q., Lee, K., Khattab, O., Finn, C. Meta-Harness: End-to-End Optimization of Model Harnesses. arXiv:2603.28052, March 2026. Preprint. Reports gains from automated harness optimization with fixed underlying models across text classification, retrievalaugmented math reasoning, and agentic coding.
- The Wall Street Journal. DeepSeek Lifts AI Model Prices Fourfold, August 2026; contemporaneous DeepSeek pricing materials and notices. V4 pricing introduced peak and off-peak bands with peak output rates twice off-peak rates. Reported pricing change.